당사 팬 페이지에 가입하십시오
- 조회수:
- 40084
- 평가:
- 게시됨:
-
이 코드를 기반으로 한 로봇이나 지표가 필요하신가요? 프리랜스로 주문하세요 프리랜스로 이동
Hello.
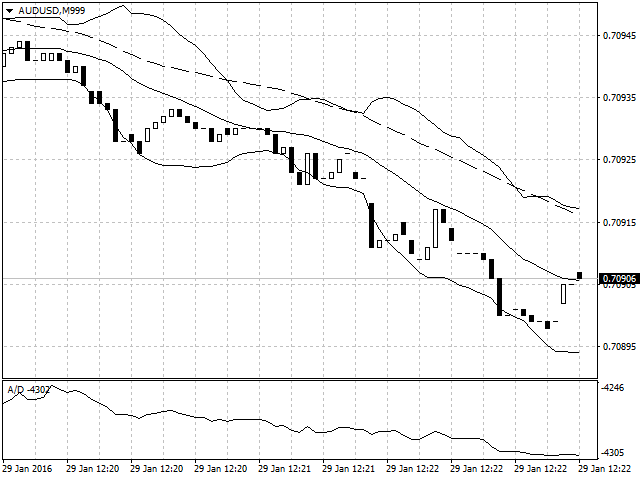
Perhaps you, like me, sometimes need to estimate the duration of the price movement and the difference of BUY and SELL volumes inside a price candlestick. At such moments, I think of a tick chart. There are various programs that gather ticks, but I did not find any easy to use and suitable for analysis.
The presented indicator is based on the standard MQL4 period converter. This decision allowed to collect ticks to the standard history file and open the tick chart as an offline chart.
The indicator also includes a block for updating the offline chart at every new tick.
This results in a standard MetaTrader chart with the period of 1 tick. Therefore, all the features that exist in your terminal are available for such chart.

MetaQuotes Ltd에서 러시아어로 번역함.
원본 코드: https://www.mql5.com/ru/code/14714
 Assistant for checking strategies on history data
The indicator was developed to help analyze the interesting strategies, and also to practice and gain experience in analyzing the signals on history data in the selected strategy.
 Zonal Trading
The Expert Advisor which uses AO and AC. Buying and selling is performed when the colors of the indicators match.
 Future_Indicator
The indicator based on the moving averages shifted to the left relative to the chart.
 Hodrick-Prescott Channel
The indicator draws a price channel using the Hodrick-Prescott Filter.