당사 팬 페이지에 가입하십시오
- 조회수:
- 60418
- 평가:
- 게시됨:
- 2015.09.10 10:27
- 업데이트됨:
- 2016.11.22 07:32
-
이 코드를 기반으로 한 로봇이나 지표가 필요하신가요? 프리랜스로 주문하세요 프리랜스로 이동
ChangeLog:
v1.03:
- Correction for more stability.
- Works now fine with symbols with 1 digit.
- Correction on the EA, better information on error, correct the open order.
v1.02:
- Added Magic Number.
- Added button Stop Loss On/Off.
- Correction on the indicator and the EA, pending order correction (don't forget to update the EA).
Money Manager Graphic Tool shows Lot Size, Ratio, Risk and opens orders (Buy, Sell, Buy Stop, Buy Limit, Sell Stop, Sell Limit).
- Hit "B" key to open the Money Manager Graphic Tool, a Buy line with is SL and TP will appear at the mouse position.
- If you want to Sell hit "S". You can change the letter if you want.
- If you want the Sell or Buy line to follow the price, just click "Follow price" button.
- If you don't want a TP, it's easy to make it disappear.
- You can move all the line, the money manager graphic tool will automatically update.
- You can change the risk or the lot size in the sandbox section.
- At the bottom, you can see your broker limits.
- If you reach one of these limits, the relevant line will turn red.
- You can move the dialog box on the screen, use the left-up rectangle, if you don't want to move, double-click on it.
How to install:
- Load indicator as usual;
- Add Money_Manager_EA to your chart;
- Check to allow opening trades;
- Enable "AutoTrading".
The steps 2,3,4 are needed to activate the button of the Money Manager Graphic Tool, the button allows you to open a trade with all the information you have selected.
Parameters:
extern string  BuyLine="B";                     //Key to Create a Buy Line
extern string  SellLine="S";                    //Key to Create a Sell Line
extern int     Risk=2;                          //Your Percentage Risk
extern double  DefaultSL=30;                    //Default SL in Pips
extern color   ColorBuySell=clrGreen;           //Color of the Buy or Sell line
extern color   ColorSL=clrRed;                  //Color of the SL line
extern color   ColorTP=clrDarkOrange;           //Color of the TP line
extern color   ColorTextBox=clrWhite;           //Color of text in the toolbox
extern ENUM_LINE_STYLE  LineStyle=STYLE_SOLID;  //Style of Lines
extern int     Linewidth=2;                     //Choose the width of the line
extern bool    Account=true;                    //Choose Balance [true] or Equity [false]
extern bool    CreateTP=true;                   //Create a Take Profit line
extern bool    TransparancyBox=false;           //The dialog box is transparent
extern color   BoxColor=clrBlack;               //Background box color
extern int     MagicNumber=951357;		//Magic Number
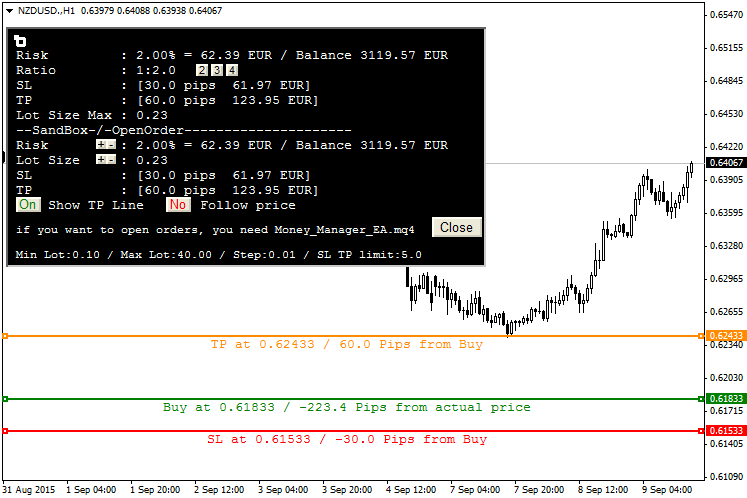
In the previous image, the "B" was hit and the mouse was at 0.61833. The button to Order doesn't appear because the Money_Manager_EA.mq4 is not loaded.
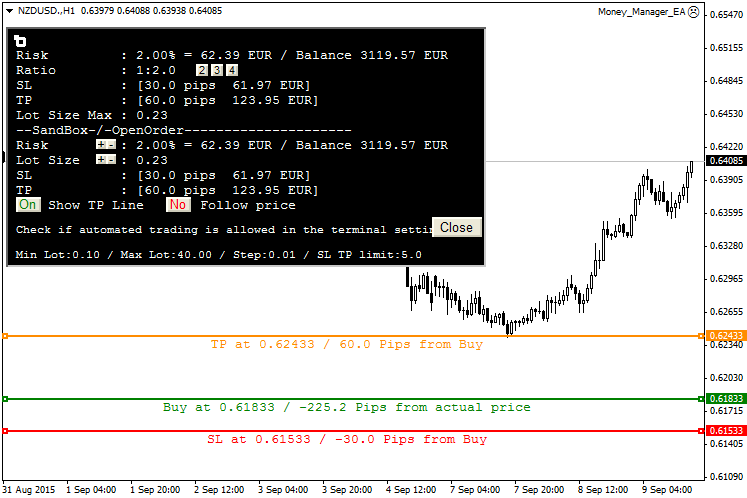
The Money_Manager_EA.mq4 is loaded, but "AutoTrading" is not activated.
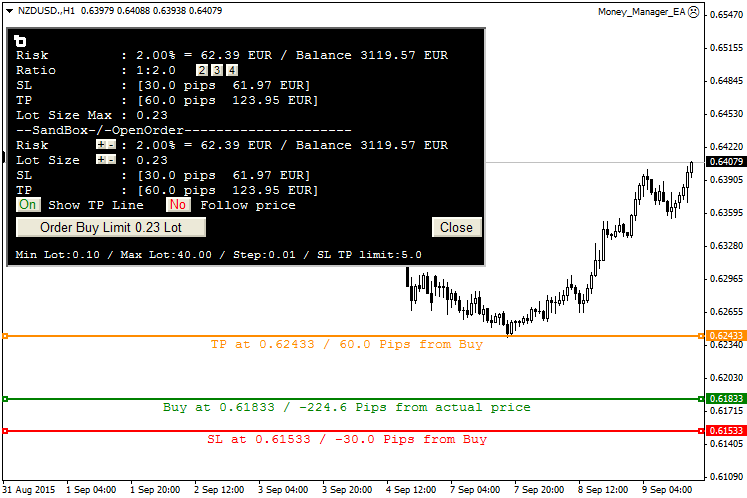
Yes, the button is here, but the smiley at top-right corner is not happy, you need to activate "Allow live trading" in the Money_Manager_EA options.
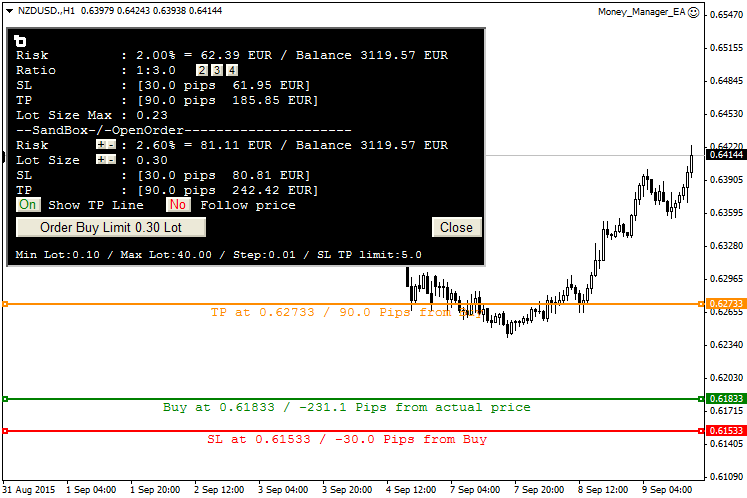
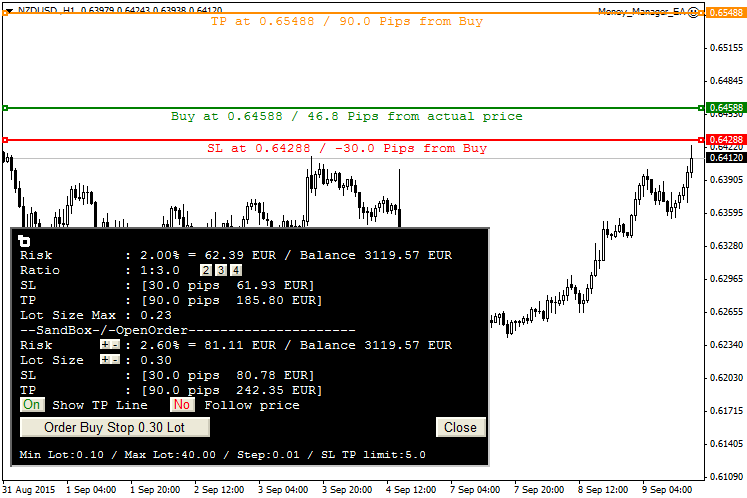
Buy, Sell, Buy Limit, Sell Limit, Buy Stop, Sell Stop will be automatically chosen. If a TP or SL information goes red, you reach your broker SL/TP limit. If the Lot Size information goes red, you reach your broker Min or Max lot.
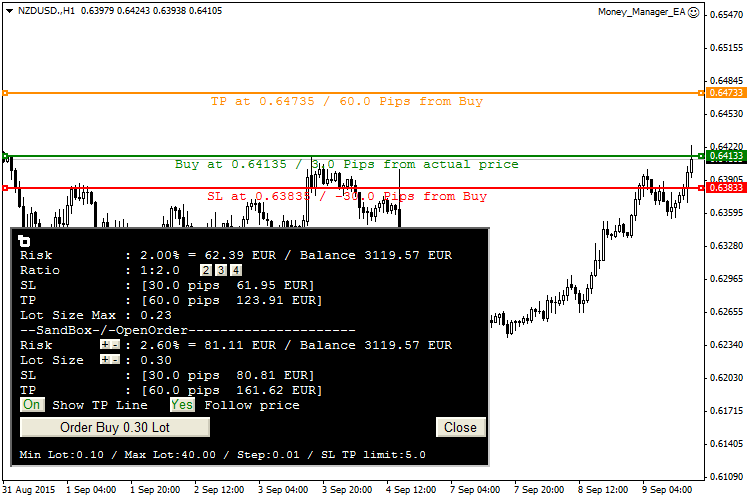
Choose to follow price, you will open a simple Buy or Sell, the buy line will automatically move with the price, and the TP and SL will follow too.
Recommendations:
- Sometimes the price moves too fast, so the order will not be opened, an alert will pop up, you can click again on the order button if you want.
- I used it for more than a week without any worries. If you have any problems, please let me know.
 ATR Values
This indicator plots the values of the user specified ATR period for all timeframes as a text block. The text block corner can be changed by the user.
 Triangular MA
Draws a Triangular Moving Average on the chart.
 Close All Orders by Current Symbol
This EA will show the button that can used to close all orders by the current chart symbol.
 Volatility Step Channel
This indicator shows Step Channel based on volatility.