당사 팬 페이지에 가입하십시오
- 조회수:
- 33269
- 평가:
- 게시됨:
- 2015.05.27 10:00
- 업데이트됨:
- 2016.11.22 07:32
-
 이 코드를 기반으로 한 로봇이나 지표가 필요하신가요? 프리랜스로 주문하세요
프리랜스로 이동
이 코드를 기반으로 한 로봇이나 지표가 필요하신가요? 프리랜스로 주문하세요
프리랜스로 이동
Changelog:
- Version 1.02: Added new functionality, button to change lot size, choose a different timeframe.
- Version 1.01: Some bug corrections and added more information.
Information provided:
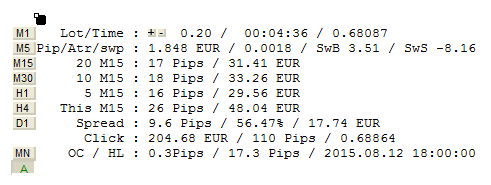
- Button to change the timeframe, or to put it in auto mode.
- Button + and - to change the lot size, you can use "P" and "M" shortcut to change lot size.
- Line 1 : Lot Size / countdown of the current candle / the price at the mouse position.
- Line 2 : Pip value in your currency / Atr / Swap Buy / Swap Sell.
- Line 3 : Average pips in the last 20 period of the timeframe choose / the same information but in money.
- Line 4 : Same thing but in the last 10 period.
- Line 5 : Same thing but in the last 5 period.
- Line 6 : Same thing in the actual candle.
- Line 7 : Spread in Pips / the percentage of spread over the average 5 period / spread in your currency.
- Line 8 : When you click on the chart you can have in your currency the value between the actual price and the mouse click / idem in Pips / the mouse click price.
- Line 9 : When you move the mouse, you can have the number of pips between Open and Close of a candle / the Pips between High and Low of the candle / the datetime of the candle.
- You can activate the range of the period choose.
- You can activate the Estimated Time of Arrival of your take profit.
The parameters are:
- Lot: the lot you usually use.
- Label Color: choose the color of the text, white is the default.
- ActiveRangeLine: you can view the range of the average range of the last 5 periods. [True/False]
- LineColor: you can change the color of the range line.
- ActiveTakeProfitETA : give the date and hour of when your take profit could be touch. [True/False]

When you move your mouse on the chart you can see the value in pips between Open and Close [OC] and the Hight and Low [HL].
You can also see the black square, you can move it on your chart, and the text will follow.
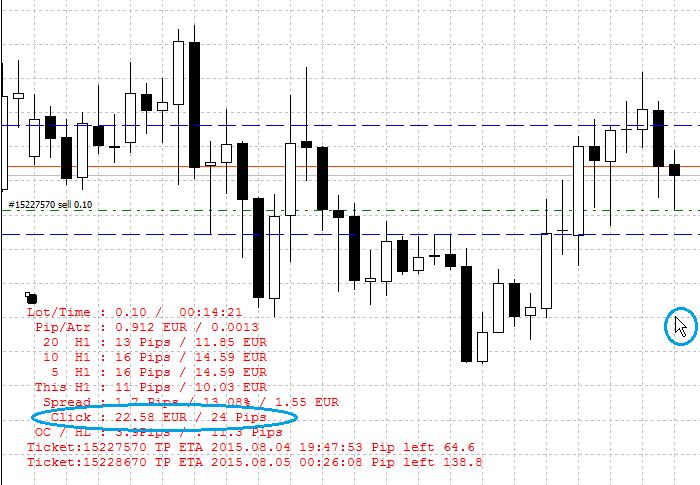
When you click on the chart it tells you (in your currency) how much money separate the click and the actual market price (based on the pip value). So you can know before opening a trade the potential of this one, and see if the risk is profitable.
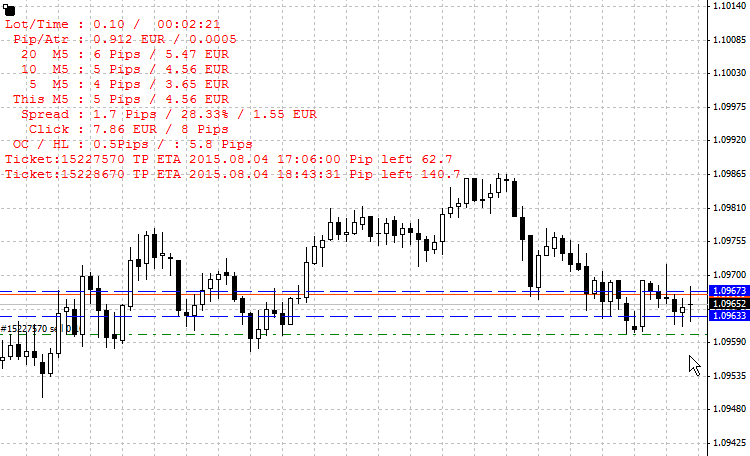
You can see the range of the period based on the average of the last five period. Here it's the blue line.
You can see two trades with a Take Profit, the first take profit can be touch at this date and hour, of course, the hour changes a lot, but it's good to know if you need to wait 1 week or few hours.
 SDX-TzPivots
Calculation of pivot and similar levels based on time zones.
MA Triple Median
This indicator draws 3 Moving Averages by median price.
Pivot Point with adjustable closing time
Pivot Point (PP) indicator for use on timeframes < D1 with adjustable preceding day close time, elimination of sunday bars, optional display of weekly and monthly PP, preview of tomorrows' PP and current days' midpoints.
 Convert time to double and vice versa
Library to convert datetime to double and vice versa.