당사 팬 페이지에 가입하십시오
- 조회수:
- 12967
- 평가:
- 게시됨:
- 2012.12.21 12:36
- 업데이트됨:
- 2016.11.22 07:32
-
이 코드를 기반으로 한 로봇이나 지표가 필요하신가요? 프리랜스로 주문하세요 프리랜스로 이동
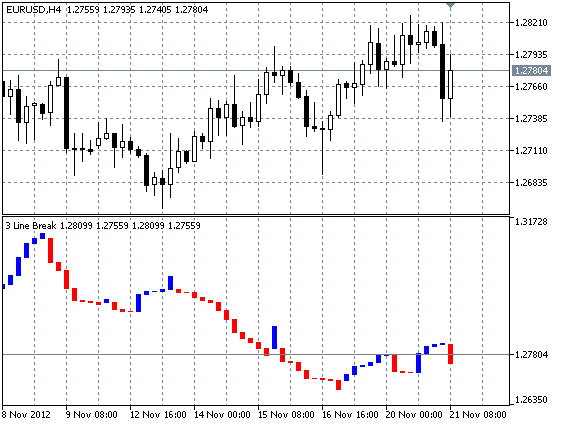
The charts of linear reversal represent a series of vertical boxes (lines) which direction and size are determined by dynamics of prices. This type of charts is drawn on close prices and considers neither timeframe, nor volume.
The main advantage is lack of a freely defined reversal value as far as it is signaled by the market behavior. The chart sensitivity of the three linear breakthrough can be regulated by changing number of lines that market should break to design the reversal.

Recommendations:
- The general recommendation is a buy after appearance of a blue box after a series of red boxes, and a sell after appearance of a red box after a series of blue boxes. However, as in many cases, brute force solution of task will be optimal. Therefore, in my opinion it is better to use a linear breakthrough in combination with other instruments and find their own patterns (in TLB charts).
MetaQuotes Ltd에서 러시아어로 번역함.
원본 코드: https://www.mql5.com/ru/code/1298
 Exp_ColorNonLagDotMACD
The Exp_ColorNonLagDotMACD Expert Advisor drawn on the basis of the signals taken from the ColorNonLagDotMACD histogram
 Exp_AML
Trading system using the AML trend Moving Average
 Kagi
Kagi
The Kagi chart drawn in a separate subwindow
 Exp_ColorMETRO
Trading system using the ColorMETRO indicator