당사 팬 페이지에 가입하십시오
- 조회수:
- 7658
- 평가:
- 게시됨:
- 업데이트됨:
-
이 코드를 기반으로 한 로봇이나 지표가 필요하신가요? 프리랜스로 주문하세요 프리랜스로 이동
The real author:
Daniil V. Bugayev
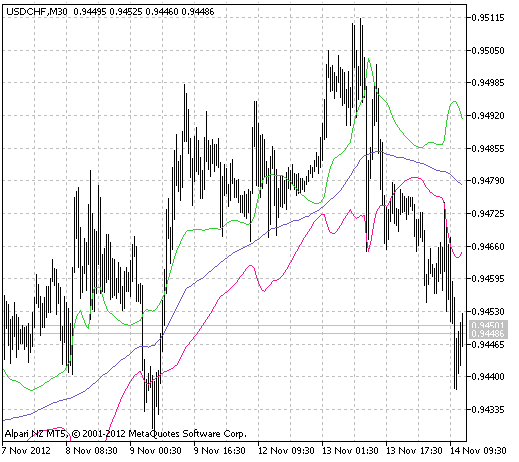
Frequently, using a fixed size channel cause difficulties because of the changing market volatility. The offered indicator does not have such disadvantage and it changes the channel size depending on the average value of candlesticks. At the same time most of the functional common to the Moving Average indicator is saved. In fact, it is the Keltner channel on which instead of the usual simple averaging for the size of candlesticks is the possibility to use one of the ten versions of averaging:
- SMA - simple Moving Average;
- EMA - exponential Moving Average;
- SMMA - smoothed Moving Average;
- LWMA - linear weighed Moving Average;
- JJMA - adaptive averaging JMA;
- JurX - ultralinear averaging;
- ParMA - parabolic averaging;
- T3 - Tillson's multiple exponential smoothing;
- VIDYA - smoothing using Tushar Chande's algorithm;
- AMA - smoothing using Perry Kaufman's algorithm.
It should be noted that Phase1 and Phase2 parameters have completely different meaning for different smoothing algorithms. For JMA it is an external Phase variable changing from -100 to +100. For T3 it is a smoothing ratio multiplied by 100 for better visualization, for the VIDYA it is a CMO oscillator period and for the AMA it is a slow EMA period. In other algorithms these parameters do not affect smoothing. For AMA fast EMA period is a fixed value and is equal to 2 by default. The ratio of raising to the power is also equal to 2 for AMA.
This indicator was first implemented in MQL4 and published in Code Base on 16.07.2009.
The indicator uses SmoothAlgorithms.mqh library classes (must be copied to the terminal_data_folder\MQL5\Include). The use of the classes was thoroughly described in the article "Averaging price series for intermediate calculations without using additional buffers".

Fig.1 The XMA_Range_Bands indicator.
MetaQuotes Ltd에서 러시아어로 번역함.
원본 코드: https://www.mql5.com/ru/code/1273
 Spectrometr_Separate
Financial asset oscillation spectrum
 Trend Continuation Factor
The indicator to determine the trend and its directions.
 Exp_XMA_Range_Bands
The breakthrough system using the XMA_Range_Bands indicator.
 ShowOpenDayLevel
The indicator displaying the level of opening day at any timeframe (less than two hours) with the ability to perform the shift of day start time and consider the presence of Sundays in the chart