당사 팬 페이지에 가입하십시오
- 조회수:
- 49495
- 평가:
- 게시됨:
- 2012.12.13 10:55
- 업데이트됨:
- 2016.11.22 07:32
-
이 코드를 기반으로 한 로봇이나 지표가 필요하신가요? 프리랜스로 주문하세요 프리랜스로 이동
When a new bar is occurred, the indicator defines points to draw trend lines and, if the coordinates of points are changed, it redraws the lines. When determining the points, the current bar is ignored. Support line is drawn on low, resistance line is drawn on high. There are two points of determining in the indicator. Both types are described below on the example of the support line.
Main parameters:
- InpLineType - Line type
- InpLeftExmSide - Left extremum side* (Type 1, 2)
- InpRightExmSide - Right extremum side (Type 1)
- InpFromCurrent - Offset from the current bar (Type 2)
- InpPrevExmBar - To consider bar before extremum (Type 2)
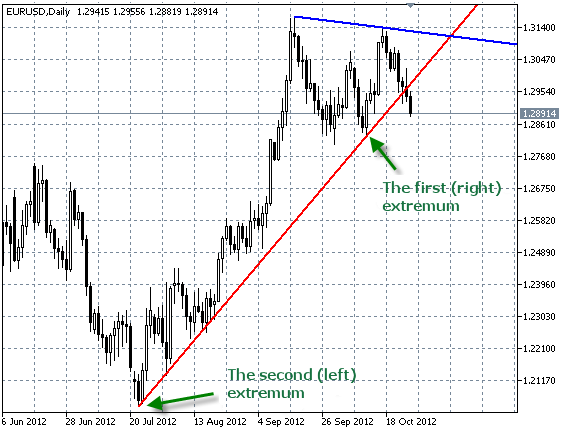
Type 1. By two extremums.
- From the next to last bar "go" to the left and search for the first (right) point-extremum from InpRightExmSide bars on the either side.
- From the first point again "go" to the left and search for the second (left) point-extremum from InpLeftExmSide bars on the either side.
- Draw the trend line.

Type 2. Extremum and delta.
- From the next to last bar "go" to the left and search for the second (left) point-extremum from InpLeftExmSide on the either side.
- Starting from InpFromCurrent bar from the current and to the second point of the extremum, searching for the bar with the lower delta**. Two variants are possible: consider/not consider bar from the right side of the second point.
- Draw the trend line.
а) Lines are drawn considering bar from the right side of the left point.

а) Lines are drawn without considering bar from the right side of the left point.

*The extremum means such a bar, on the left and right side of which there are N bars with the higher lows and the lower highs. In fact, the extremum is practically identical to the N-bar fractal.
**Delta calculates using the following formula:
to support: (right price - left price) / (right bar index - left bar index)
to resist: (left price - right price) / (right bar index - left bar index)
Recommendations:
- The extremum on the left side should be more valuable than the extremum on the right side, that is why the parameter of its side is set higher.
- It is recommended to observe for the behavior of the indicator with small value of its parameters on time frame М1 before appliance.
- In my opinion the line of the second type (extremum and delta) are more dynamic, and more correspond to the existing on the market.
- After each parameter is noted on what type of drawing it affects (the exceptions are such properties of the line as thickness and color).
MetaQuotes Ltd에서 러시아어로 번역함.
원본 코드: https://www.mql5.com/ru/code/1220
 The MACD with the definition of price extremums
The method of the advanced adaptation with a zero delay on the volatility front
 Volatility_FBA_NR
The indicator to search extremums of volatility
 Exp_TrendValue
Trading system drawn on the basis of the signals of the TrendValue indicator
 HaDelta
The HaDelta indicator can help to be ahead the crowd.