당사 팬 페이지에 가입하십시오
- 조회수:
- 22186
- 평가:
- 게시됨:
- 2013.06.03 07:22
- 업데이트됨:
- 2014.04.21 14:56
-
이 코드를 기반으로 한 로봇이나 지표가 필요하신가요? 프리랜스로 주문하세요 프리랜스로 이동
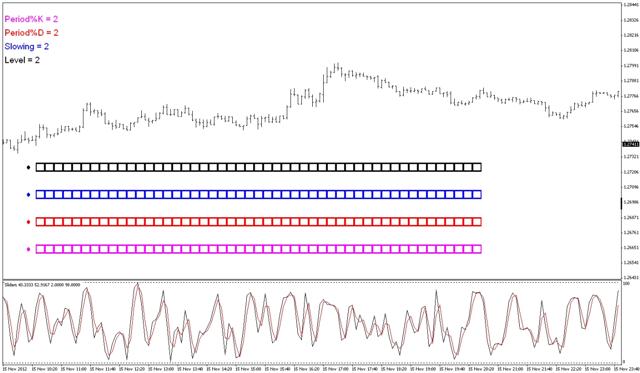
Adjust the period (and other values) of a technical indicator quickly and easily, by using up to 4 visual "sliders" in the chart window - without having to manually change the values in the input window or even having to take your eyes off the indicator.
Each slider consists of up to 50 separate boxes in a horizontal line across the chart window. Each box has an associated value. There is a circular "marker" or "token" which can be placed in any box to select that value. The selected value is then applied to the chosen parameter of the indicator in the separate window, and the indicator is automatically updated. This indicator uses MT4 chart objects, and makes no use of DLLs.
The external variables allow you to choose how many sliders to display (up to 4), what values to start and end each slider with, the increment of value increase between each subsequent box (up to a maximum of 50 boxes per slider), the description and colour associated with each slider, the number of bars to be counted in the indicator and whether or not to display the X and Y coordinates of the first marker. The slider values may include decimals and/or minus numbers.
The chart objects are displayed as labels, and therefore will stick to the window. The object positions are set by X and Y coordinates. The default settings for these coordinates are described within the code and can be easily adjusted (requiring a re-compilation).
The default indicator is Stochastic. If you would like to use a different indicator then enter the relevant code in lines 448-451, and simply replace one of the parameters with the relevant slider array.
If you would like to use an indicator which is displayed in the chart window then change line 34 to "#property indicator_chart_window".
The slider values will only update once per tick. If you wish to use this when there are no ticks coming in (eg. at the weekend) then you will need to update the chart in another way. One method is simply to press Alt+C+R. Another method is to use a separate script which will automatically post a "fake tick", such as the one described here: http://forum.mql4.com/35406/page2#373533.

Author: clerin6 (a.k.a mimp)
 VR---FIGURA
Different view of the figures and the patterns of the day ....
 SK-Days of Week
Writes days of week above candles.
 Export to Excel in Real Time
Export text to Excel in real time using native DDE library provided by Windows
 Ichimoku Moving Average
Ichimoku with Moving Average instead middle Price channel (Donchian channel) .