거래 로봇을 무료로 다운로드 하는 법을 시청해보세요
당사를 Facebook에서 찾아주십시오!
당사 팬 페이지에 가입하십시오
당사 팬 페이지에 가입하십시오
스크립트가 마음에 드시나요? MetaTrader 5 터미널에서 시도해보십시오
- 조회수:
- 18587
- 평가:
- 게시됨:
- 2011.05.16 08:27
- 업데이트됨:
- 2014.04.21 14:55
-
이 코드를 기반으로 한 로봇이나 지표가 필요하신가요? 프리랜스로 주문하세요 프리랜스로 이동
LineOrder gives you the ability to place an order by using the horizontal line object from the toolbar menu.
You can also control stop loss and take profit buy moving its horizontal lines.
For example, if you what to buy EURUSD, just drag and drop a horizontal line in your EURUSD chart window.
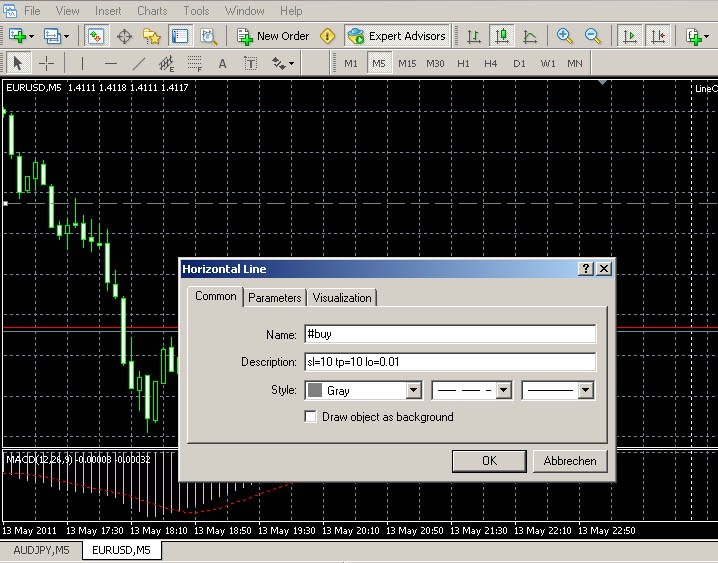
Double click on the horizontal line and change the "name" (on the common tab) to #buy and click the OK-button, that's it!
(If a double click doesn't work, go to "Tools->Options->Objects" and set the hook "Select object by single mouse click").
To close an order, just remove the horizontal-order line.
Additional options like stop-loss, take-profit, lot-size and trailing-stop can be passed into the description field.
E.g. for a 20 pips stop-loss and 10 pips take-profit just click into the description field and type: sl=20 tp=10
Use whitespace to separate options (Picture A). Default values can be set in the EA properties.
To disable an active trailing-stop, click on the horizontal-order line and write ts=-1 in the description field.

To Do: Pending Orders

Commands: (name field)
#buy  		buy order
#sell  		sell order
#selltp		sell order and set take profit at the horizontal line
#sellsl		sell order and set stop loss at the horizontal line
#buytp		buy order and set take profit at the horizontal line
#buysl		buy order and set stop loss at the horizontal line

Options: (description field)
ts		trailing stop in pips
sl		stop loss (pips)
tp		take profit (pips)
sq		stop loss (price)
tq		take profit (price)
lo		lot size
 MTF MACD scalper
This is a Multi time frame indicator based on the MACD. I was attempting to see if I could get a good entry on the M5 chart, and make the MACD values of the H1,H4,D align with the M5.
 VSA by the master the market e-book
this indicator is from the e-book master the market of Tom Williams, calling VSA method. It plots many arrow sign of the weakness and strength definition. Just point the mouse out at the sign, then the definition will show.
 3-Candle Chart
Simple chart to display candlesticks for the 3 following periods: London Open to New York Open, New York Open to London Close, London Close to New York Open.
 GodBot
GodBot EA is using Bollinger Bands together with DEMA, Moving Average and Candlesticks. (EURUSD M5)