당사 팬 페이지에 가입하십시오
- 조회수:
- 137
- 평가:
- 게시됨:
-
이 코드를 기반으로 한 로봇이나 지표가 필요하신가요? 프리랜스로 주문하세요 프리랜스로 이동
개체를 사용하지 않는 피벗 기준점은 사용 가능한 전체 히스토리에 걸쳐 구축됩니다.
5가지 계산 옵션. 세 가지 구성 변형: 일별, 주별, 월별. 일별 레벨의 경우 GMT 오프셋 옵션이 있습니다.
계산에 사용되는 공식:
피벗_클래식
피벗(P) = (H + L + C) / 3
저항(R1) = (2 * P) - L 지지 (S1) = (2 * P) - H
R2 = P + H - LS2 = P - H + L
R3 = H + 2 * (P - L )S3 = L - 2 * (H - P)
피벗_피보나치
피벗(P) = (H + L + C) / 3
저항(R1) = P + 0.382(H - L) 지지 (S1) = P - 0.382(H - L)
R2 = P + 0.618*(H - L) S2 = P - 0.618*(H - L)
R3 = H + *(H - L )S3 = L - (H - L)
PIVOT_DEMARK
C < O이면 X = H + 2 * L + C;
C > O이면 X = 2 * H + L + C;
C = O이면 X = H + L + 2 * C;
저항(R1) = X / 2 - L; 지지(S1) = X / 2 - H
피벗_카마릴라
R4 = (H - L) X 1.1 / 2 + C R3 = (H - L) X 1.1 / 4 + C R2 = (H - L) X 1.1 / 6 + C R1 = (H - L) X 1.1 / 12 + C
S1 = C - (H - L) X 1.1 / 12 S2 = C - (H - L) X 1.1 / 6 S3 = C - (H - L) X 1.1 / 4 S4 = C - (H - L) X 1.1 / 2
피벗_우디
피벗(P) = (H + L + 2 X C) / 4
저항(R1) = (2 X P) - L 지지(S1) = (2 X P) - H
R2 = P + H - LS2 = P - H + L

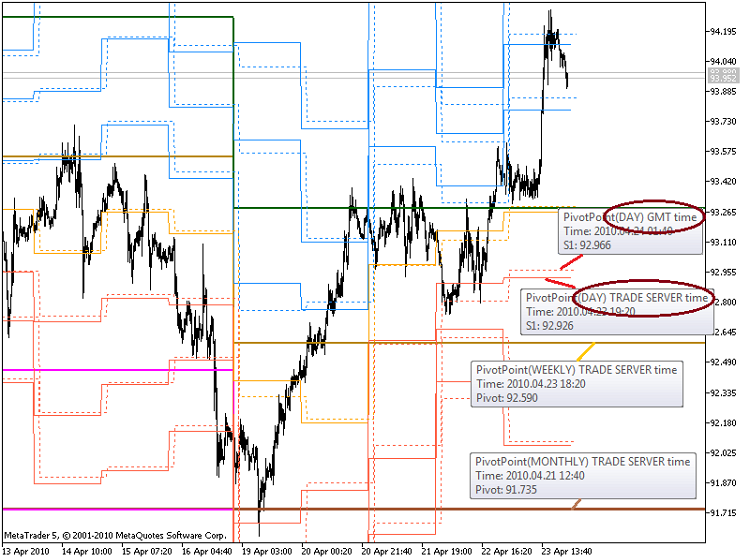
그림은 서로 다른 매개 변수를 가진 PIVOT_CLASSIC 유형의 4 가지 표시기를 보여줍니다. 첫 번째 매개변수는 일일 피벗을 설정할 때만 영향을 줍니다.
오류를 발견하면 포럼에 글을 쓰시면 수정하겠습니다.)
MetaQuotes Ltd에서 러시아어로 번역함.
원본 코드: https://www.mql5.com/ru/code/102
 수학적 머레이 선(지지와 저항)
이 인디케이터는 개체를 사용하지 않고 사용 가능한 전체 기록에 머레이 수학 라인을 구축합니다.
 제로래그 MACD
이전 막대를 기준으로 히스토그램 막대 색상이 지정된 제로래그 MACD.
 사용자 지정 B맵 차트
이 보조지표는 화면 중앙에 BMP 이미지를 차트에 표시하는 것이 유일한 목적인 메타트레이더 5용 사용자 지정 보조지표입니다. 용도는? 분석 및 시장 데이터에 영향을 주지 않고 정적 이미지(로고, 개인 브랜딩, 차트 메시지 또는 알림)를 거래 차트에 직접 표시하는 데 사용됩니다. 어떻게 작동하나요? MQL5Images 폴더에서 이미지(2.bmp)를 표시하기 위해 OBJ_BITMAP_LABEL 객체를 생성합니다. 자동으로 차트 중앙을 계산하여 이미지를 배치합니다. 창 크기를 조정해도 항상 중앙에 위치하도록 새 틱이 나올 때마다 이미지 위치를 업데이트합니다.
 Brooky Trend Strength for MT5
이 표시기는 3개의 다른 하위 창 표시기를 호출합니다. 모든 파일은 표시기 폴더로 이동합니다.