당사 팬 페이지에 가입하십시오
- 조회수:
- 5645
- 평가:
- 게시됨:
- 2012.10.10 10:36
- 업데이트됨:
- 2016.11.22 07:32
-
이 코드를 기반으로 한 로봇이나 지표가 필요하신가요? 프리랜스로 주문하세요 프리랜스로 이동
The indicator of two unspecified time intervals.
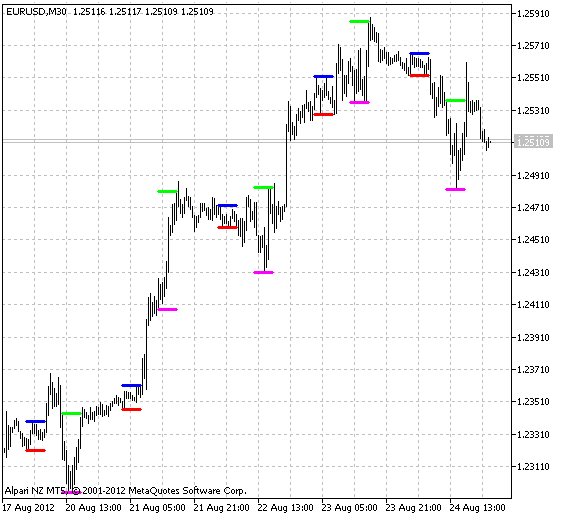
This is an intraday indicator showing the trading range within a trading day. Four time points are taken from the external parameters, the high and low points between each of the pairs are specified. These extreme points are shown in horizontal lines.
The indicator is useful for testing both breakout and pullback strategies.
The following parameters can be set in the indicator:
//+----------------------------------------------+
//| Indicator input parameters                   |
//+----------------------------------------------+
input string Start1   = "03:00";   // origin of 1
input string End1     = "08:00";   // end of 1
input string Start2   = "12:00";   // origin of 2
input string End2     = "17:00";   // end of 2
input uint   nDays = 2;          // number of counting days (0-all)
input int    Shift=0; // horizontal shift of the indicator in bars

i-AnyRange2
MetaQuotes Ltd에서 러시아어로 번역함.
원본 코드: https://www.mql5.com/ru/code/1015
 TimeSeries - Function Library for Working with Time Series
Function Library for Working with Time Series: iTime, iOpen, iHigh, iLow, iClose, iHighest, iLowest, iBarshift. Short invocation version is available for all functions (with the current chart's symbol and period).
 InfoMarket
This is an informative script displaying data on the current trading pair in the chart window.
 Exp_ATR_Trailing
The Expert Advisor moves Stop Loss of the open position along the border of the channel built using ATR_Trailing.
 PositionInfo
The simple indicator for displaying some relevant information about a position right in the chart window.