당사 팬 페이지에 가입하십시오
- 조회수:
- 18350
- 평가:
- 게시됨:
- 2011.02.24 09:03
- 업데이트됨:
- 2016.11.22 07:32
-
이 코드를 기반으로 한 로봇이나 지표가 필요하신가요? 프리랜스로 주문하세요 프리랜스로 이동
Use the Strategy Tester as simulator. Currently only market orders (BUY and SELL) are supported. Orders are set trough the use of scripts which gets executed by the EA. You can set an initial Stoploss/Takeprofit in the scripts and modify them afterward trough drag&drop of the the lines drawn by the EA. Very simple concept and easy to use.
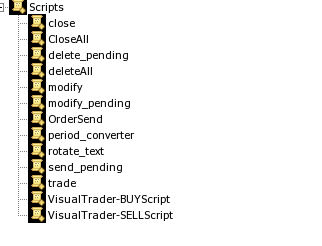
Use the VisualTrader-BUYScript to place a buy order and the VisualTrader-SELLScript to place a sell order.

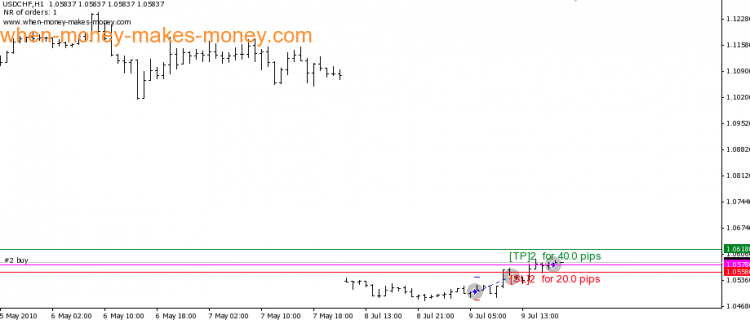
Then you can modify the TakeProfit and Stoploss trough drag&drop of the Green (TP) and Red(SL) lines
Installation:
- Copy VisualTrader-SimulatorEdition.mq4 into: *YourMT4Directory*/experts/
- Copy VisualTrader-BUYScript.mq4 into: *YourMT4Directory*/experts/scripts/
- Copy VisualTrader-SELLScript.mq4 into: *YourMT4Directory*/experts/scripts/
- Restart Your Terminal
- Open StrategyTester
- Select VisualTrader-SimulatorEdition and choose your desiderated timeframe.
- Check Visual mode
- Press Start and trade.
 Programmatic modification of Tester "From:" and "To:" fields with user32.dll
This script uses the Windows API to modify the "From:" and "To:" fields within the strategy tester according to user input. For this script the strategy tester should already be open. Tested on Windows 7 64 bit. If you are using another version of win
 Daily trend ZCOMFX v2
Daily trend indicator to show up to 6 pairs and arrows on your chart.
 Daily Breakdown
The Expert Advisor places stop orders and waits for breakdown of the last day or time period.
 BBSqueeze Dark Indicator
Indicator shows buy and sell regions based on combination of Bollinger bands and Keltner channels.
