당사 팬 페이지에 가입하십시오
- 조회수:
- 14033
- 평가:
- 게시됨:
- 2012.09.21 16:45
- 업데이트됨:
- 2016.11.22 07:32
-
이 코드를 기반으로 한 로봇이나 지표가 필요하신가요? 프리랜스로 주문하세요 프리랜스로 이동
Real author:
Vladimir Hlystov
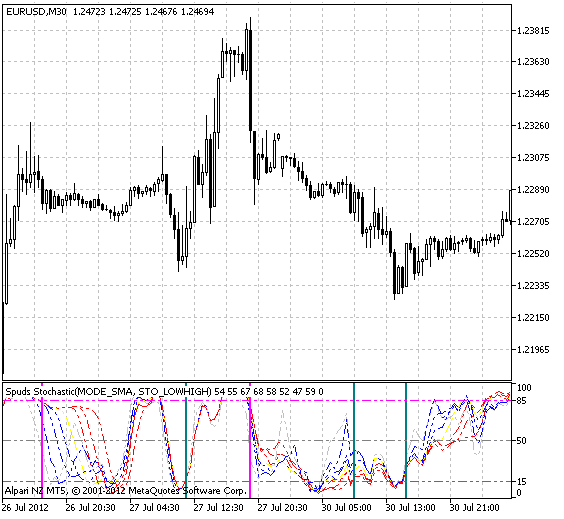
The indicator contains 8 Stochastic oscillators.
The default value of «Slow» and «period %D» parameters is left – 3. %K will change from 6 to 24.
Thus, we have 8 Stochastics with the following parameters (6, 3, 3), (9, 3, 3), (12, 3, 3), (14, 3, 3), (16, 3, 3), (19, 3, 3), (21, 3, 3), (24, 3, 3).
Only the main line is used for all indicators.
When all Stochastics are gathered together forming a single thin line (a bundle of lines), we should prepare for a deal. The bundle should form the peak and turn in the opposite direction. This is the moment for market entry. The peak should be located within overbought / oversold areas or near their borders.
Color bars are set when all Stochastics leave overbought / oversold areas.
Indicator input parameters:
//+-----------------------------------+
//| Input parameters of the indicator |
//+-----------------------------------+
input int LevelUp = 85; // level of overbought zone
input int LevelDn = 15; // level of oversold zone
input ENUM_MA_METHOD ma_method=MODE_SMA; // smoothing type
input ENUM_STO_PRICE price_field=STO_LOWHIGH; // stochastic calculation method

SpudsStochastic
This indicator was first implemented in MQL4 and published in Code Base at mql4.com 7.03.2012 (in Russian).
MetaQuotes Ltd에서 러시아어로 번역함.
원본 코드: https://www.mql5.com/ru/code/1002
 XRSX_BB_HTF
This indicator is a modified version of RSI that can be placed on a chart having another timeframe. It also allows users to change RSI and the signal line's smoothing algorithms.
 XLineRegression
XLineRegression creates levels based on the linear regression algorithm.
 2 Symbols on Chart
The indicator displays the second chart over the main one using the reference point.
 Spread Of Symbols
The indicator shows the chart of the difference (sum) of trading symbols' prices. It is suitable for visual estimation of trading symbols' correlation. It will be very useful for traders interested in pairs trading (spread trading). Indicator bars are synchronized by time with the bars of the chart the indicator is launched at.