Anddy Cabrera / プロファイル
- 情報
|
7+ 年
経験
|
0
製品
|
0
デモバージョン
|
|
0
ジョブ
|
0
シグナル
|
0
購読者
|
Anddy Cabrera


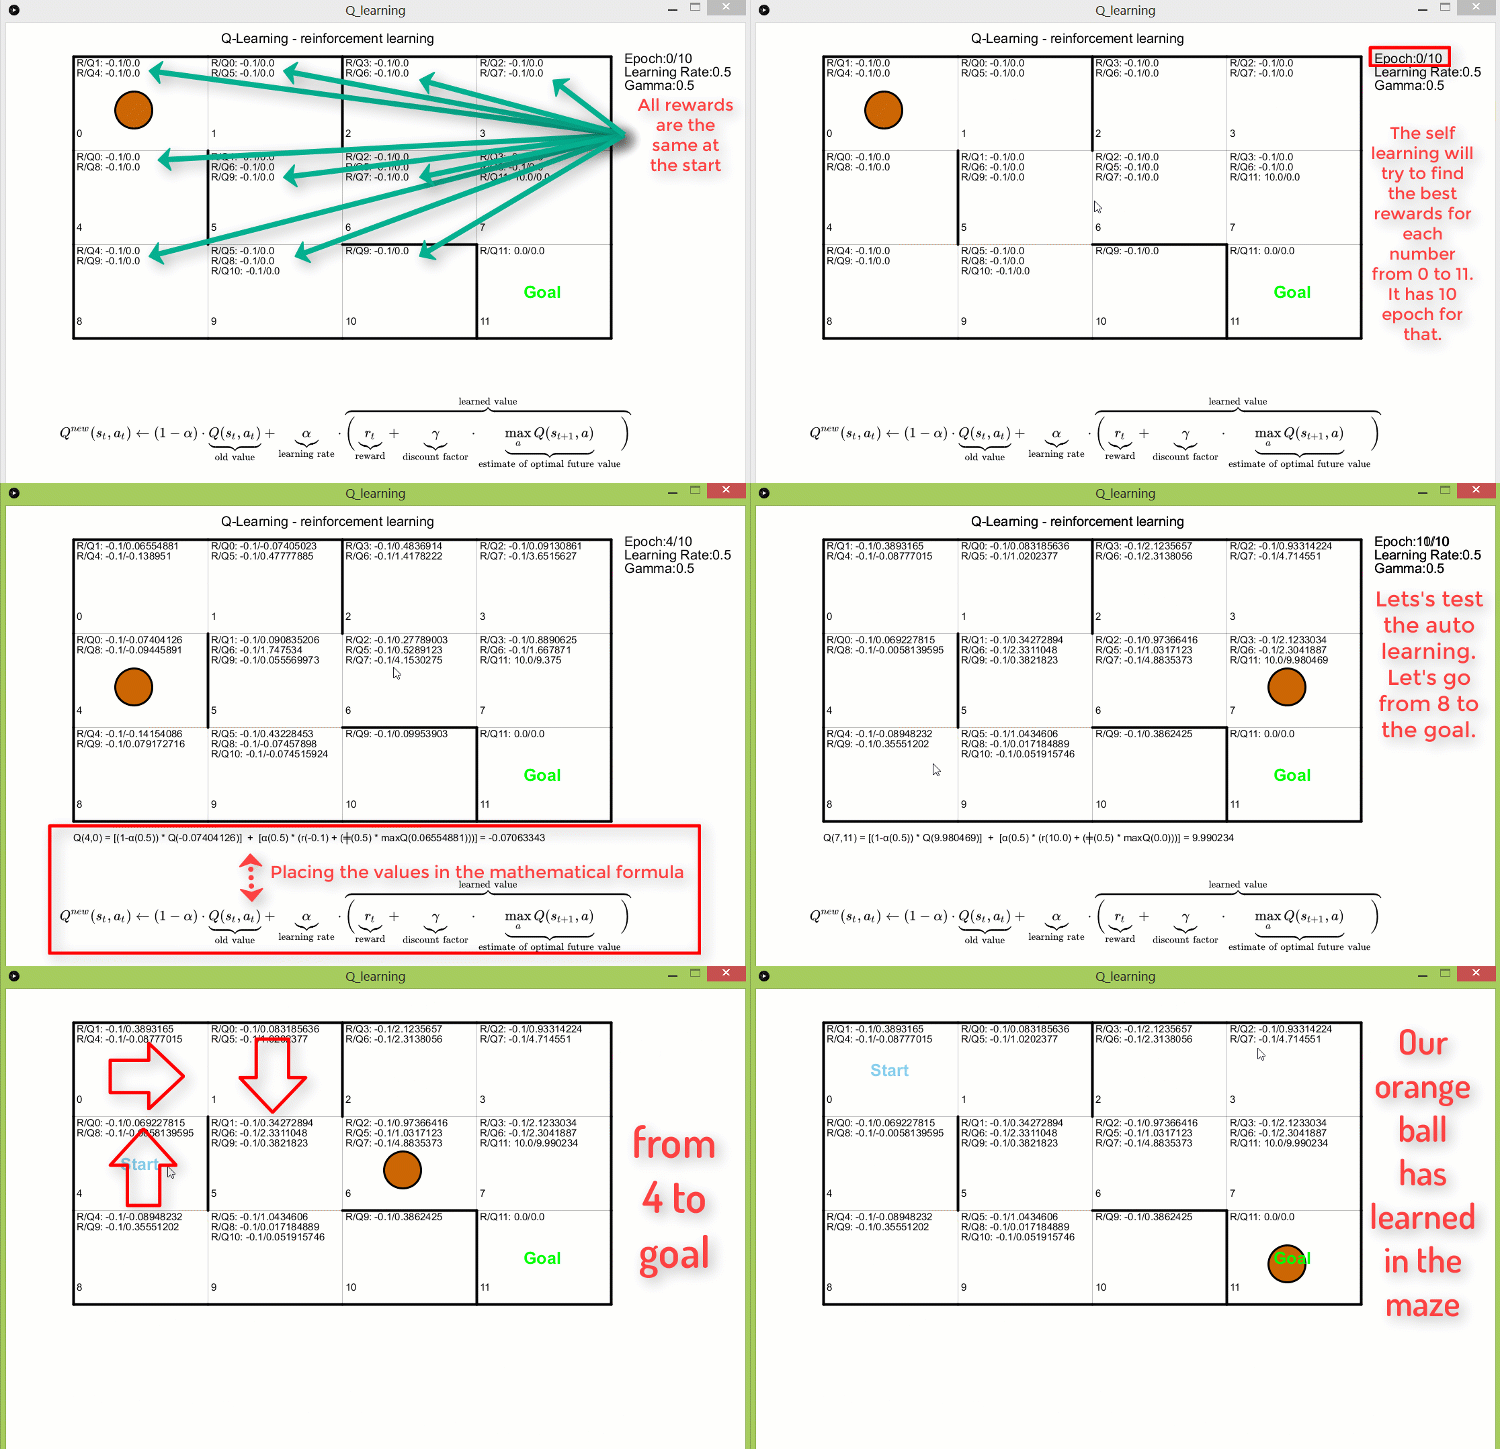
Hi Guys, I'm planning to do the following Expert Advisor using Q-Learning that is a Machine Learning reforcement learning. The descriptio fo the EA is below. I want to check how many of yours are interested so I can start the project:
Here's a high-level overview of how to implement this approach:
Define grid levels: Set grid levels at 5-pip intervals. This distance will be used to create the state space and action space for the Q-learning model.
Define the state space: The state space consists of the grid levels and the number of open positions. Each state in the Q-table will be represented as a tuple (grid level, number of open positions).
Define the action space: The action space represents the possible actions the agent can take at each state. In this case, the actions include:
Open trade at grid level i
Hold
Where i represents the index of the grid level.
Initialize the Q-table: Create a Q-table that maps each state (grid level, number of open positions) to the possible actions (open trade at grid level i, hold). Initialize the Q-table values to zero.
Define the reward function: The reward function should be based on the difference between the maximum drawdown in pips and profit in pips. This reward function encourages the Q-learning model to find actions that minimize drawdown while maximizing profit.
Determine the initial trade direction: Based on your market analysis or the Q-learning model's suggestion, determine the initial trade direction (buy or sell).
Train the Q-learning model: Train the model using historical data and the defined reward function. When updating the Q-table, consider the Martingale component by doubling the trade size after a loss and reverting to the initial trade size after a win. Ensure that the model only opens trades in the same direction as the initial trade during the training process.
Implement an exploration-exploitation strategy: Use an epsilon-greedy approach to balance exploration (trying new actions) and exploitation (using the best-known action based on the Q-table) during the training process.
Test and optimize: Test your Q-learning model with the state representation including grid level and number of open positions on out-of-sample data. Make any necessary adjustments to improve performance.
Implement the strategy: Deploy your strategy to a trading platform and monitor its performance in real-time. Ensure that the system only opens trades in the same direction as the initial trade (either all buys or all sells). Be cautious with the Martingale component, as it can lead to significant losses if a losing streak occurs. Consider using a stop-loss or other risk management measures to protect your trading account.
Arnaud Bernard Abadi
2023.07.03
Looking forward to reading your code ! Many thanks in advance. Will it be shared tru an article ?
Winged Trading
2024.01.01
I'd love to see an article on this!
Anddy Cabrera


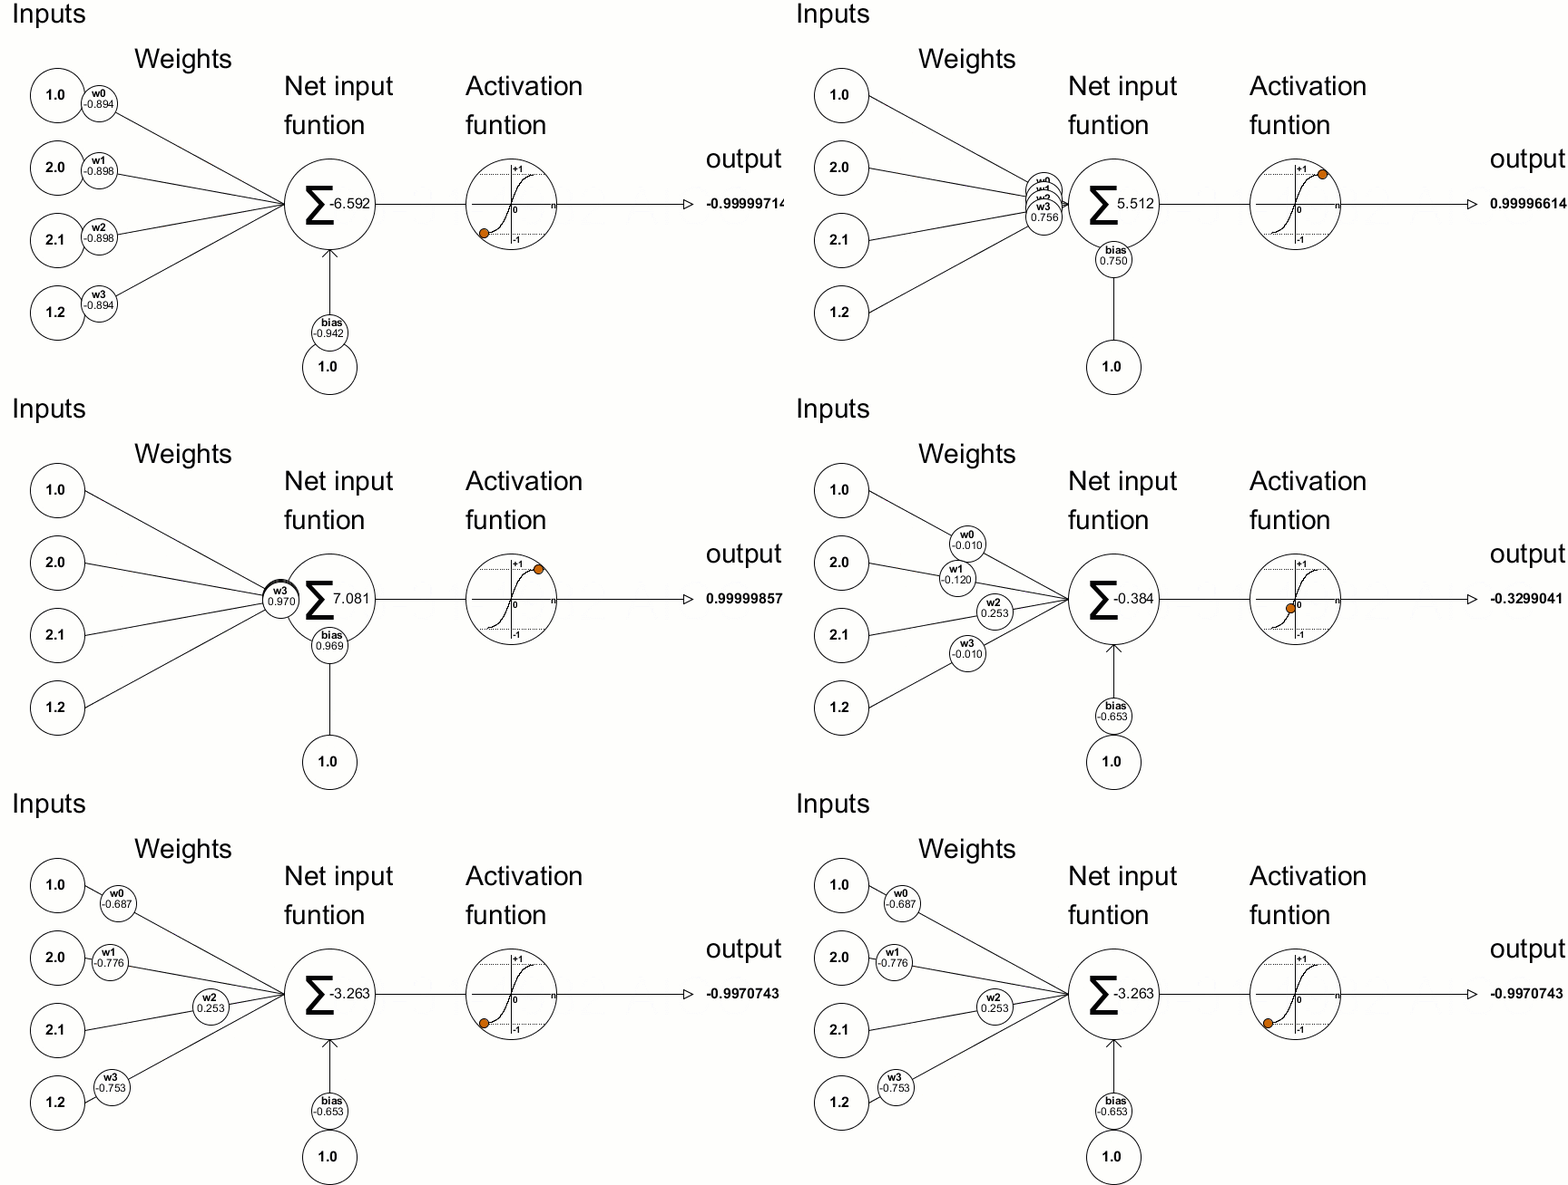
パブリッシュされた記事MQL言語を使用したゼロからのディープニューラルネットワークプログラミング 

この記事は、MQL4/5言語を使用してディープニューラルネットワークを最初から作成する方法を読者に教えることを目的としています。
ソーシャルネットワーク上でシェアする · 6
1161
Anddy Cabrera
Introduction Since machine learning has recently gained popularity, many have heard about Deep Learning and desire to know how to apply it in the MQL language...
ソーシャルネットワーク上でシェアする · 43
22428
35
Anddy Cabrera


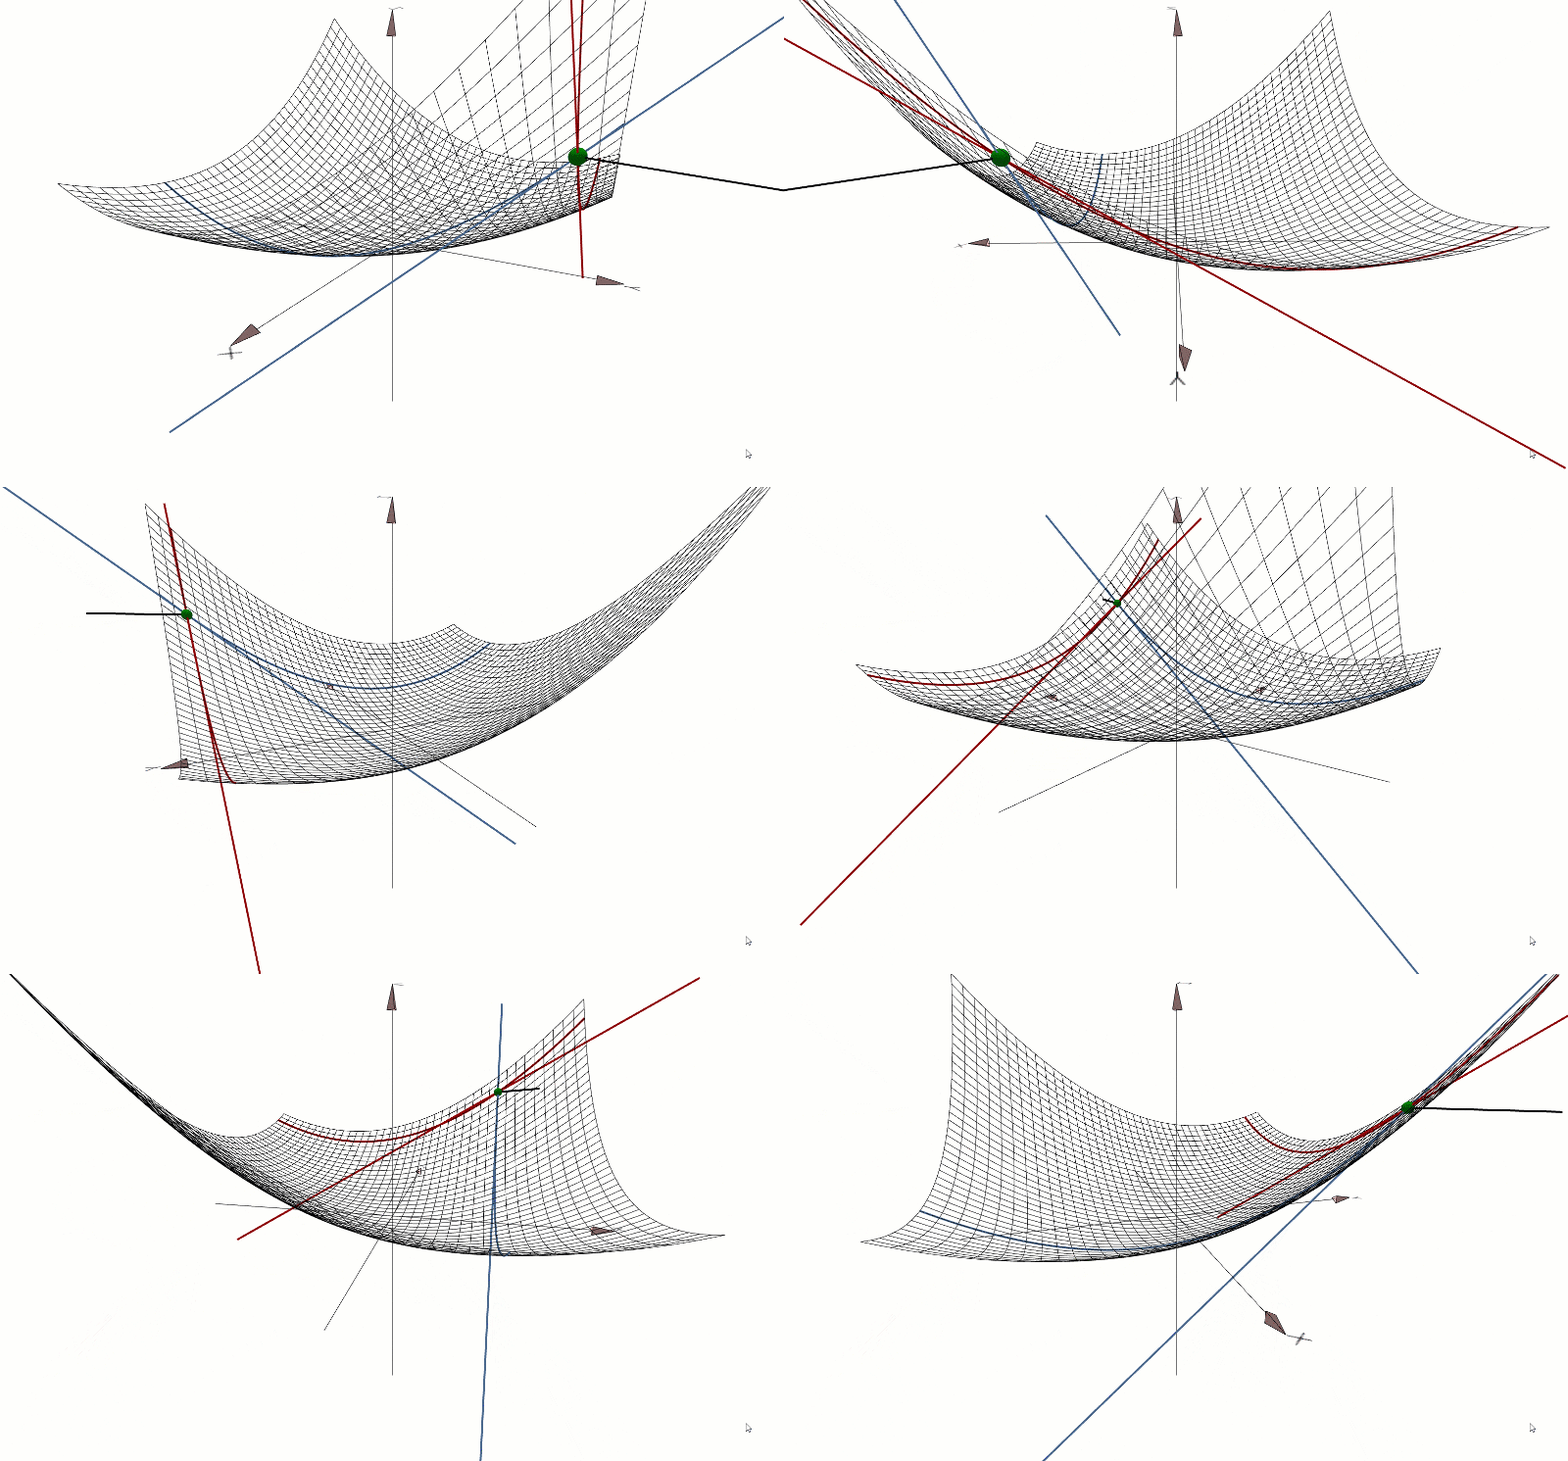
3D Cartesian plane. The derivative and the tangent line at a point on the given function curve. The gradient points in the direction of the greatest rate of increase of the function, and its magnitude is the slope of the graph in that direction. This graphic has been developed by me from scratch, using only mathematical formulas for its creation.

Anddy Cabrera

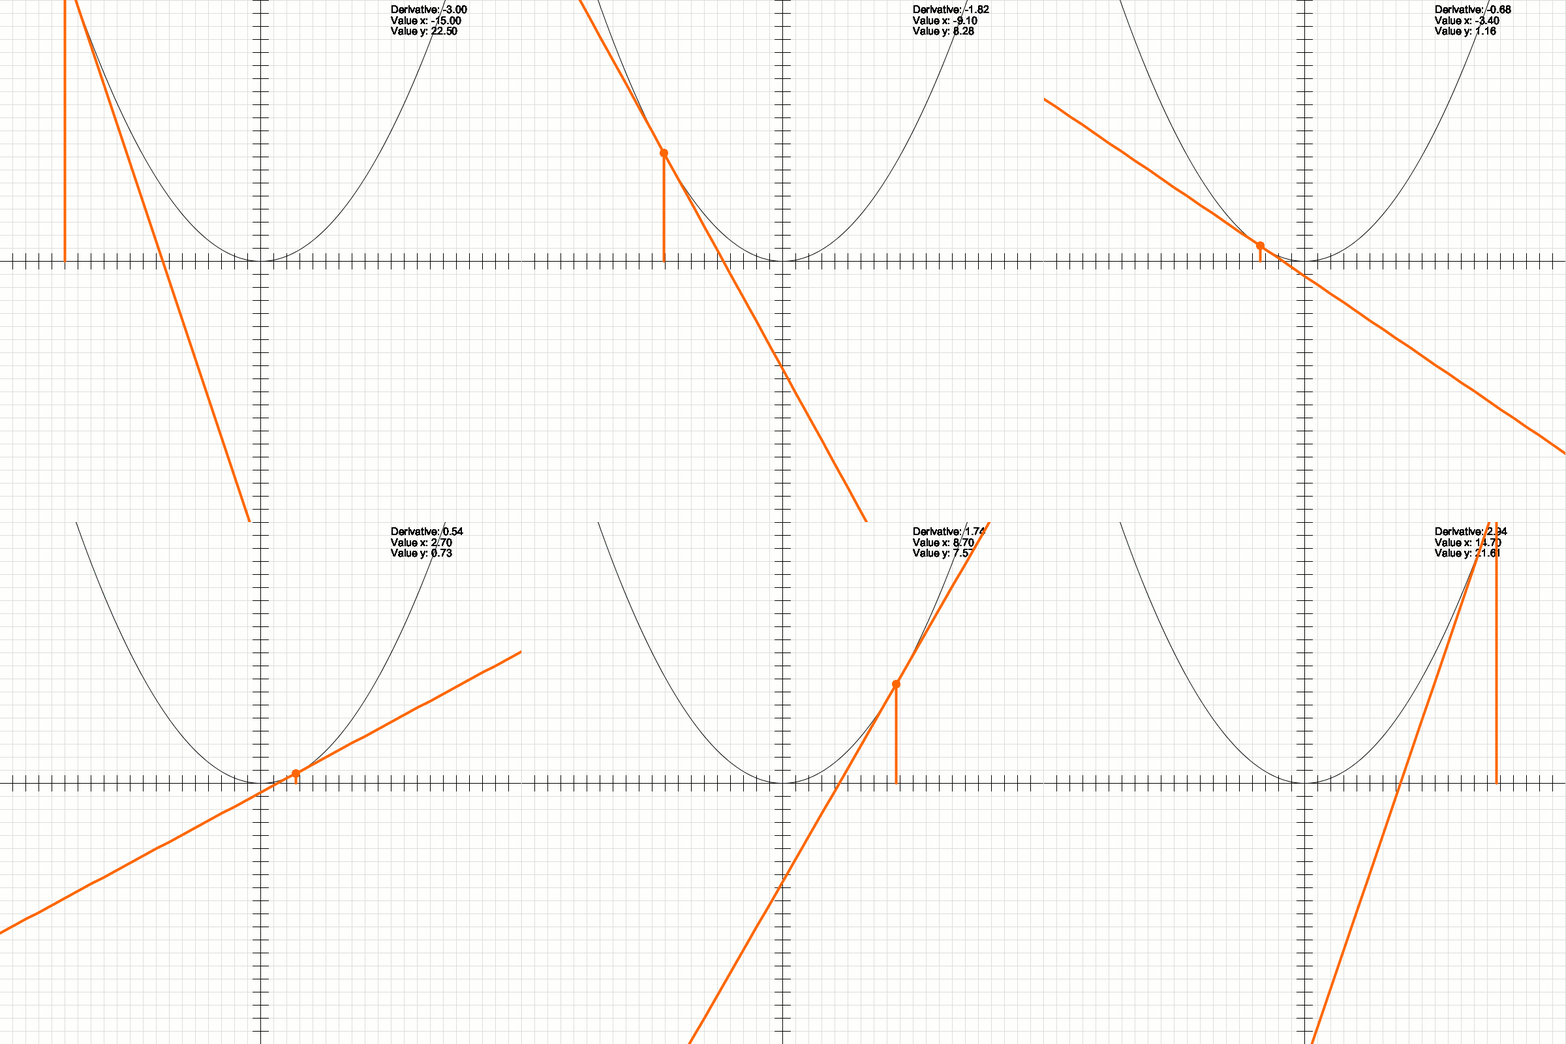
2D Cartesian plane. The derivative and the tangent line at a point on the given function curve. This graphic has been developed by me from scratch, using only mathematical formulas for its creation.

:


