|
8+ 年
経験
|
0
製品
|
0
デモバージョン
|
|
0
ジョブ
|
0
シグナル
|
0
購読者
|
Professional trader, developer, programmer. I independently developed my own methodology in 2021. After 7000 experiments, the financial "eternal" algorithm "Fractality of the Future" was created in 2019.
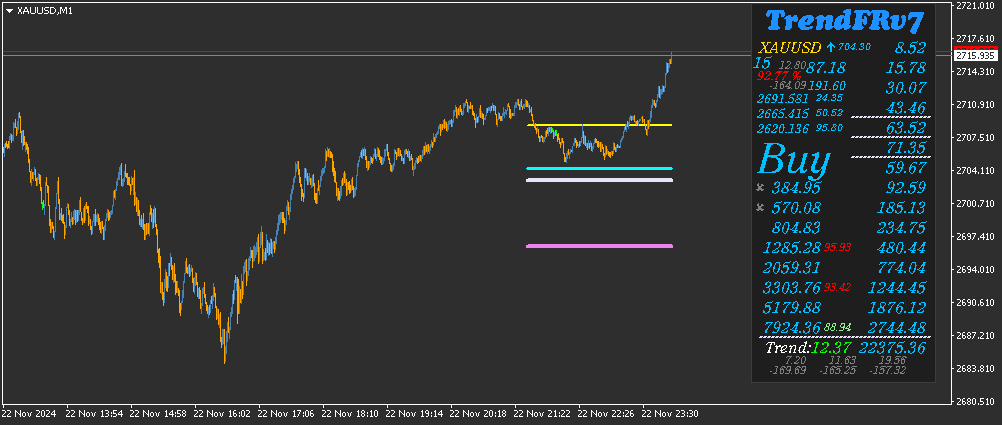
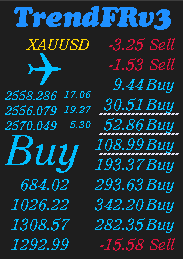
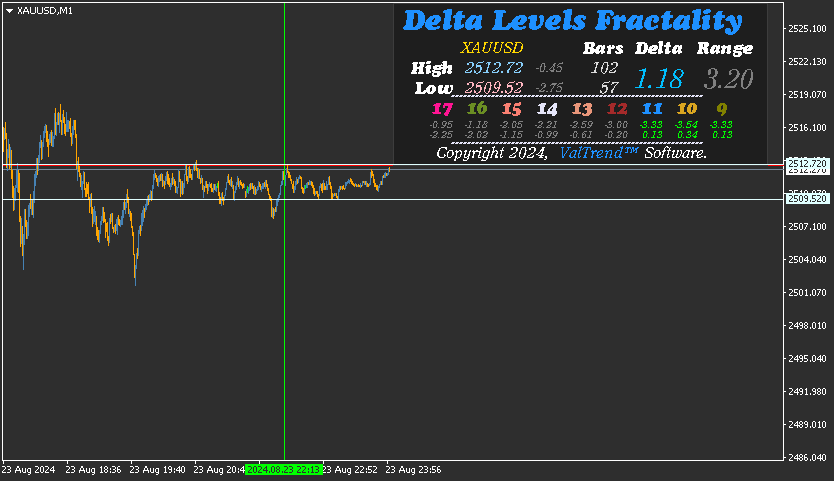
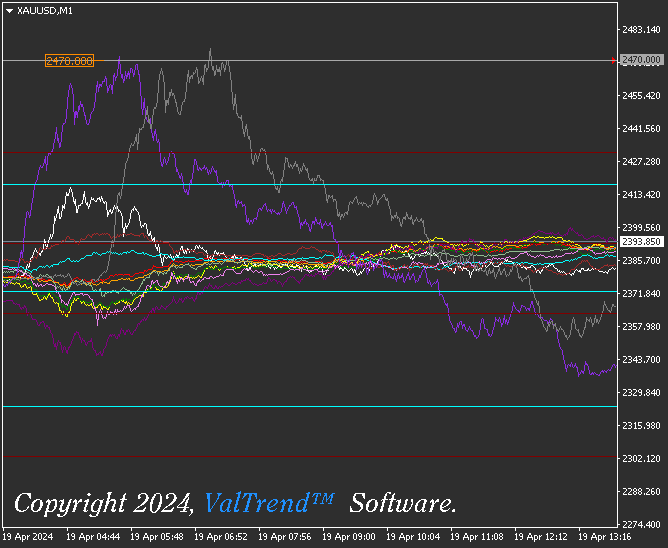
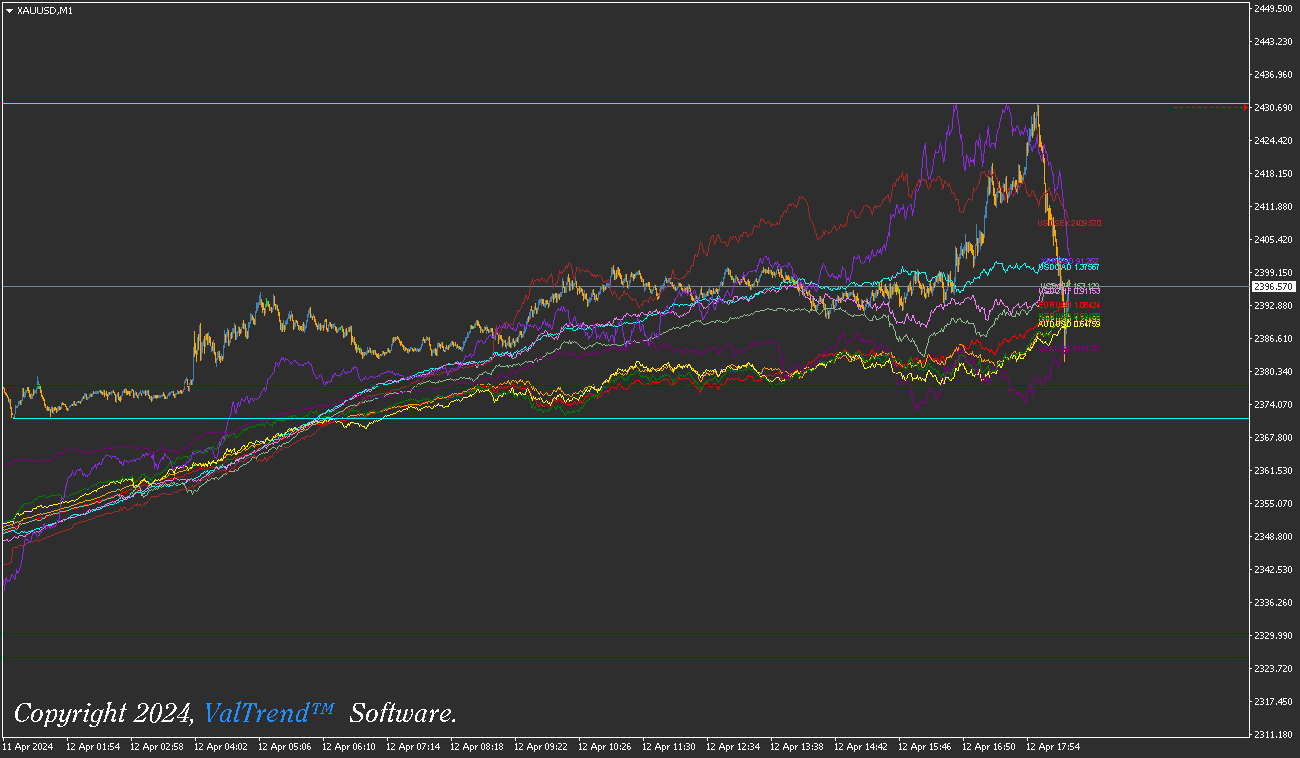
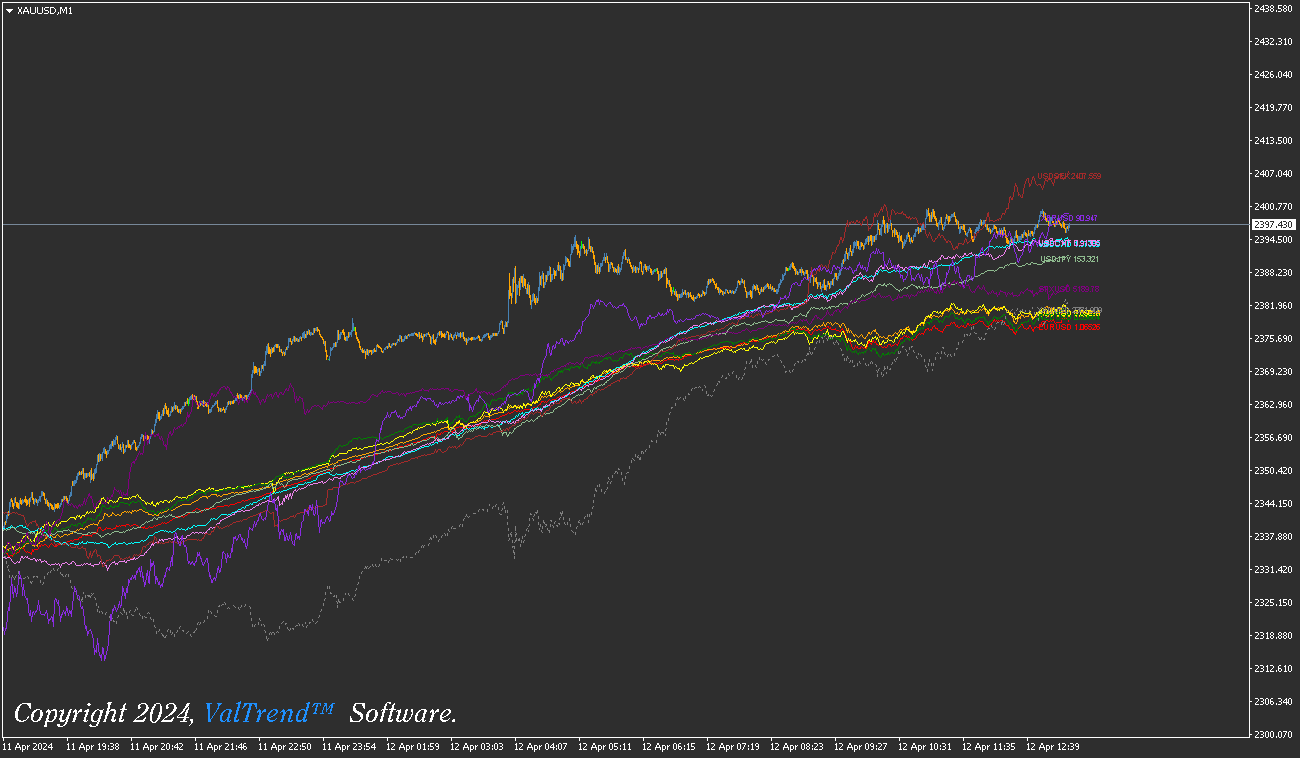
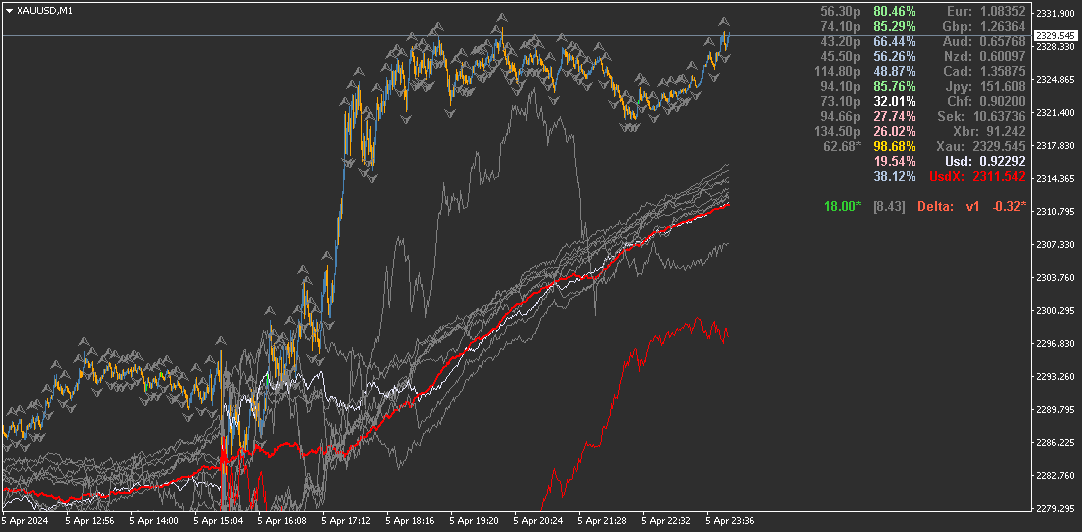
Wrote many supporting programs: ValTrend ™, Secret of Billions ™, Gold Money Hunter, Fractality of Consolidation, Hunt for Fractality, Fractality of Reversal ™, etc.
Developed programs for calculating risks:
- "Order Risk" - 6 calculations of risks for opening orders;
- "Risk Management" - the program is designed to maximize the protection of finances on the account, calculates the acceptable risks.
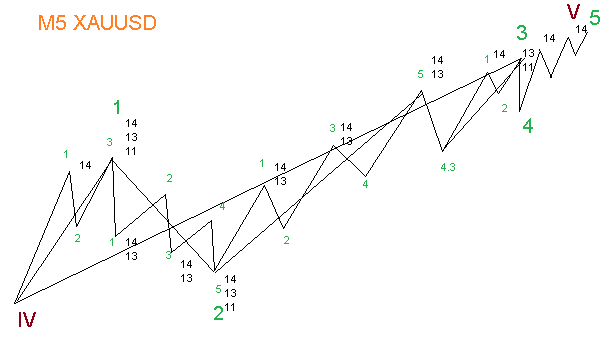
Trading principle in a nutshell: a secret, professional trading strategy. Trading is carried out on Gold (XAUUSD).
The cost of independent study is more than 5 years, more than 35,000 hours.
It took 3 years to develop the strategy framework.
Mission: To develop a unique, secure, highly profitable gold trading method (XAUUSD).
Wrote many supporting programs: ValTrend ™, Secret of Billions ™, Gold Money Hunter, Fractality of Consolidation, Hunt for Fractality, Fractality of Reversal ™, etc.
Developed programs for calculating risks:
- "Order Risk" - 6 calculations of risks for opening orders;
- "Risk Management" - the program is designed to maximize the protection of finances on the account, calculates the acceptable risks.
Trading principle in a nutshell: a secret, professional trading strategy. Trading is carried out on Gold (XAUUSD).
The cost of independent study is more than 5 years, more than 35,000 hours.
It took 3 years to develop the strategy framework.
Mission: To develop a unique, secure, highly profitable gold trading method (XAUUSD).