|
1 年
経験
|
6
製品
|
705
デモバージョン
|
|
0
ジョブ
|
0
シグナル
|
0
購読者
|
If you require guidance and advice, please feel free to send me a private message, and I will respond as soon as possible.

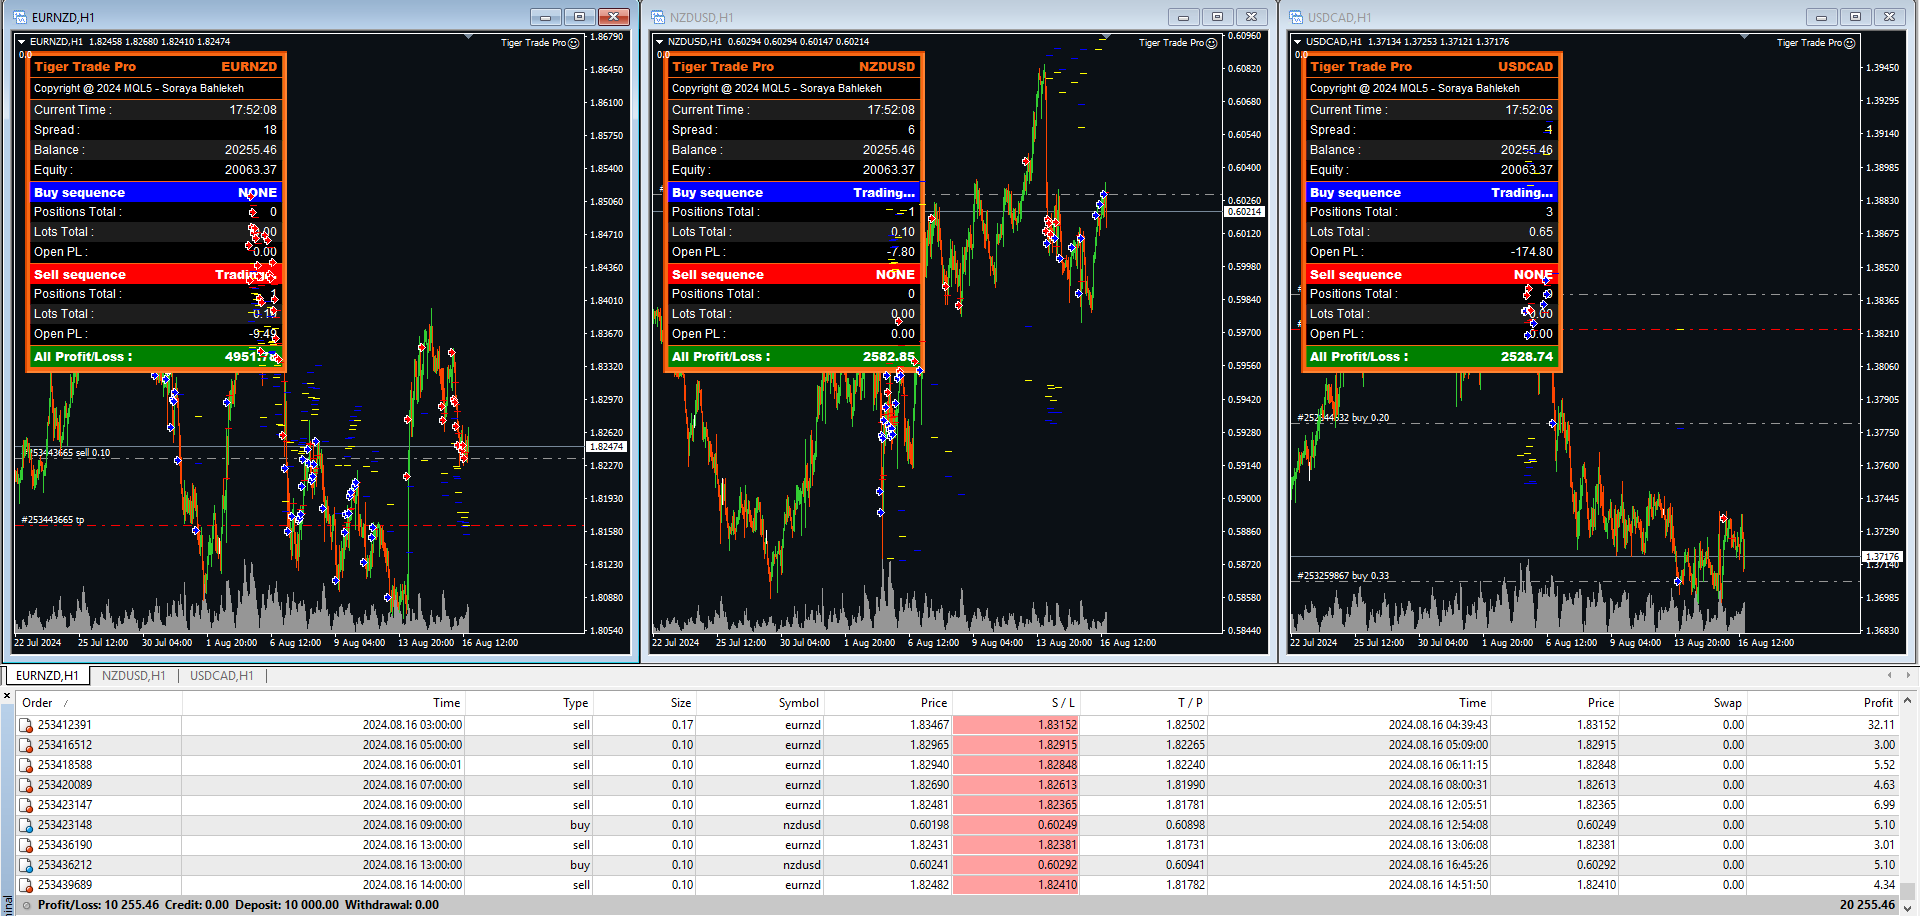


Soraya Bahlekeh

· 1
Kevin Maher
2024.01.26
Nice EA with impressive results vs. price. However, I only use the MT5 platform. Please make a MT5 version!