Luis Paulo Rodrigues Pastor / プロファイル
- 情報
|
5+ 年
経験
|
5
製品
|
20
デモバージョン
|
|
0
ジョブ
|
1
シグナル
|
0
購読者
|
Contact us if we can meet your demand.
Follow our page on Instagram @tradingbots.br
Indicator in histogram format, which is calculated using data on financial volume, tick volume and the body of the bar. It is possible to visualize moments where there was a large entry of volume, both financial and in ticks, and that the market managed to progress and advance in one direction (up or down) due to the size of the bar body, which is where there really was a victory for one side of the negotiation (buyers and sellers). By default, all bars in the indicator's histogram are colored
A very assertive and easy-to-view indicator, which can be used in any financial asset. This indicator aims to show moments when the average price deviation in relation to the average deviation exceeds the configured standard deviation. Step 1: We measure the distance between the price and the average configured in the "MAPrice" parameter; Step 2: We calculate the average "MADistancePeriod" of the distances measured in Step 1. Step 3: We calculate the standard deviation "Deviation" from the mean
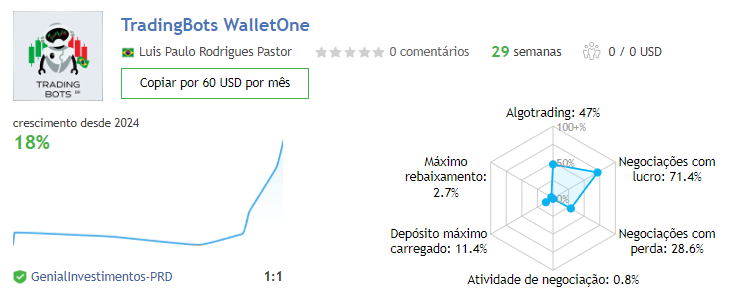
Acompanhe nossos resultados.

Indicator to mark the opening of the current day, and also the high, low and close of the previous day. It is possible to define which markings will be made and also the colors for each of the markings. It can be used in various trading assets such as Futures Markets, Stock Market, Forex, etc. You can choose to mark just the current day or for all days. When selected to mark only the current day, only that period will be marked on the graph. The markings that this indicator makes are very
一定の移動平均線上の価格からの距離を測定するために設計された指標。 指標は、間隔の値を表示するだけでなく、間隔自体の平均値を表示しており、分析の補助や確認を行うことができます。間隔値が計算される平均と平均のタイプは、間隔平均と同様にパラメータ化可能です。 設定します。 主な移動平均期間(距離の計算に使用します モバイルメディアタイプ(単純型、指数型 距離移動平均期間 注:高距離レベルをより良く表示するためには、インジケータにレベルを挿入するように指示されています。
一定の移動平均線上の価格からの距離を測定するために設計された指標。 指標は、間隔の値を表示するだけでなく、間隔自体の平均値を表示しており、分析の補助や確認を行うことができます。間隔値が計算される平均と平均のタイプは、間隔平均と同様にパラメータ化可能です。 設定します。 主な移動平均期間(距離の計算に使用します モバイルメディアタイプ(単純型、指数型 距離移動平均期間 注:高距離レベルをより良く表示するためには、インジケータにレベルを挿入するように指示されています。
Indicator designed to give investors the advantage of identifying strong candlestick patterns in real time by staining candlesticks representing these patterns, using possible buy or sell performance. The color for each pattern identified by the parameter indicator according to your taste. The candlestick patterns identified by this indicator are: Inside Bar Closing Price Reverse Top (PFRA) Closing Price Reverse Bottom (PFRB) Dave Landry Bullish Engulf Bearish Engulf Advantages: Real Time At
Indicator to mark the opening of the current day, and also the high, low and close of the previous day. It is possible to define which markings will be made and also the colors for each of the markings. It can be used in various trading assets such as Futures Markets, Stock Market, Forex, etc. You can choose to mark just the current day or for all days. When selected to mark only the current day, only that period will be marked on the graph. The markings that this indicator makes are very
Indicator designed to give investors the advantage of identifying strong candlestick patterns in real time by staining candlesticks representing these patterns, using possible buy or sell performance. The color for each pattern identified by the parameter indicator according to your taste. The candlestick patterns identified by this indicator are: Inside Bar Closing Price Reverse Top (PFRA) Closing Price Reverse Bottom (PFRB) Dave Landry Bullish Engulf Bearish Engulf Advantages: Real Time At


