Satyam Shivam / プロファイル
- 情報
|
9+ 年
経験
|
8
製品
|
538
デモバージョン
|
|
370
ジョブ
|
0
シグナル
|
0
購読者
|
フィードバック:
https://www.mql5.com/en/users/it_ mql5_1/feedbacks
終了したジョブ:
https://www.mql5.com/en/users/it_ mql5_1/portfolio
私のための新しいジョブを送信:
https://www.mql5.com/en/job/new?prefered=it_mql5_1
MQL5市場の私の製品をチェックしてください:
https://www.mql5.com/en/users/it_ mql5_1/seller
我々は非常に、専用の、意欲的にコミットし、経験豊富な専門家の会社です。私たちは、外国為替で実績のある経験と製品開発に関連バイナリーオプションと5歳の会社です。
我々は、設計する設計と様々なプロセッサアーキテクチャ(インテル/ IBM / AMDの様々なプラットフォーム(デスクトップ、ウェブ、モバイル)のための株式、オプション、先物、スワップ、スワップション、外国為替、商品の取引に関わるアートトレーディングプラットフォームの状態の開発に特化/ ARM / iphone / ipadと/ブラックベリー)CUDA、OpenCLの、MPI、OpenMPのなどのような技術を使用します(Windows / Linuxの/ Macの/のiOS / Windowsの携帯電話、のAndriod)OS、(GPU、FPGA)のような専用のハードウェアおよびクラスタ用とにC等C ++、C#、VB、VBA、MQLのような言語を使用して、Java、.NET、アマゾンAWSとMicrosoftのAzureクラウドコンピューティングプラットフォームのような様々なソフトウェア・プラットフォーム
MT4とMT5開発
エキスパートアドバイザー/ロボット、インジケータ、スクリプト、パネル、ユーティリティ、ライブラリ、アナライザの開発
外国為替およびバイナリオプション開発
FIX APIの開発
LMAX APIの開発
バイナリーオプションは、開発中のプラグイン
MT4 / MT5クライアントプラグインの開発
なぜあなたは私たちを雇う必要があります。
低開発コスト
低開発時間
信頼できる製品
業界で最高のカスタマー・サポート
クライアントの満足は私達のモットー、会議締め切りは私たちの情熱です。
Satyam Shivam
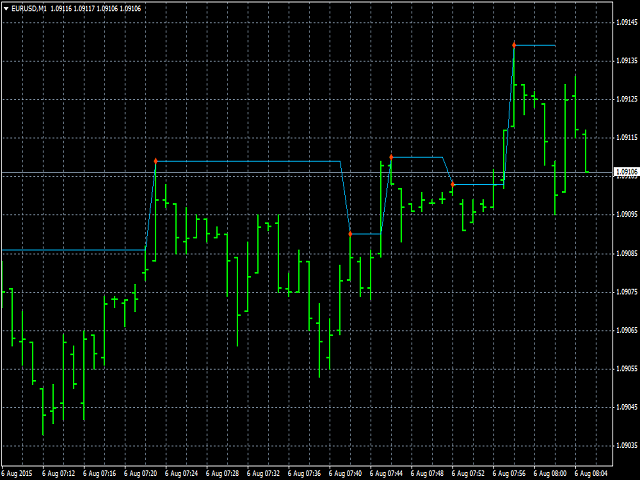
Swing High Single Time Frame Indicator
https://www.mql5.com/en/market/product/13125
Swing High Single Time Frame Indicator is one of the most advanced indicators based on the Swing High trading strategy.
https://www.mql5.com/en/market/product/13125
Swing High Single Time Frame Indicator is one of the most advanced indicators based on the Swing High trading strategy.

Satyam Shivam
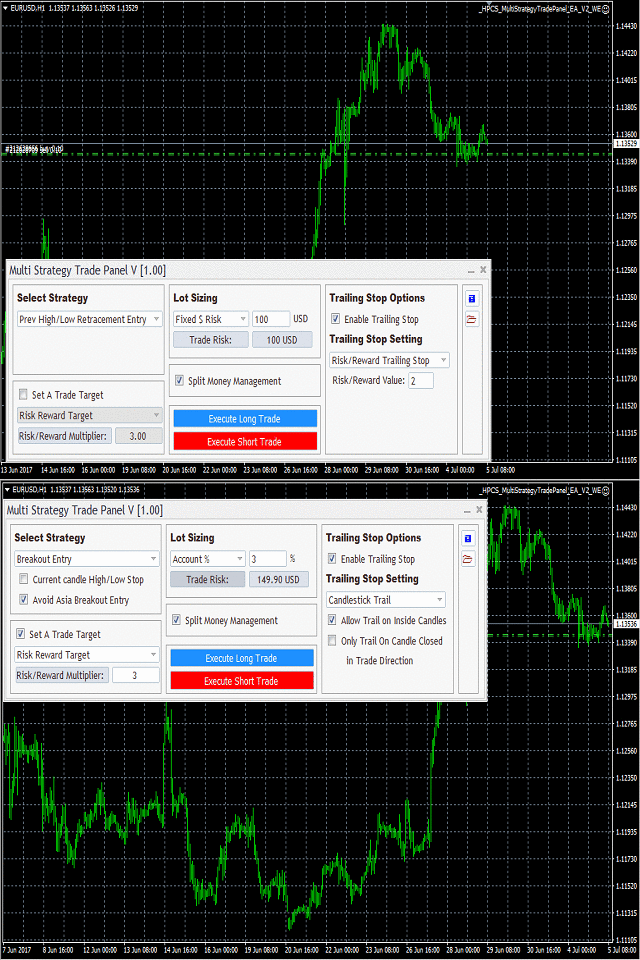
Multi Strategy Trade Panel
https://www.mql5.com/en/market/product/19738
It is one of the most advanced trading panels available.
Its advanced algorithm and feature rich user interface allows you trade on different strategies.
https://www.mql5.com/en/market/product/19738
It is one of the most advanced trading panels available.
Its advanced algorithm and feature rich user interface allows you trade on different strategies.

Satyam Shivam
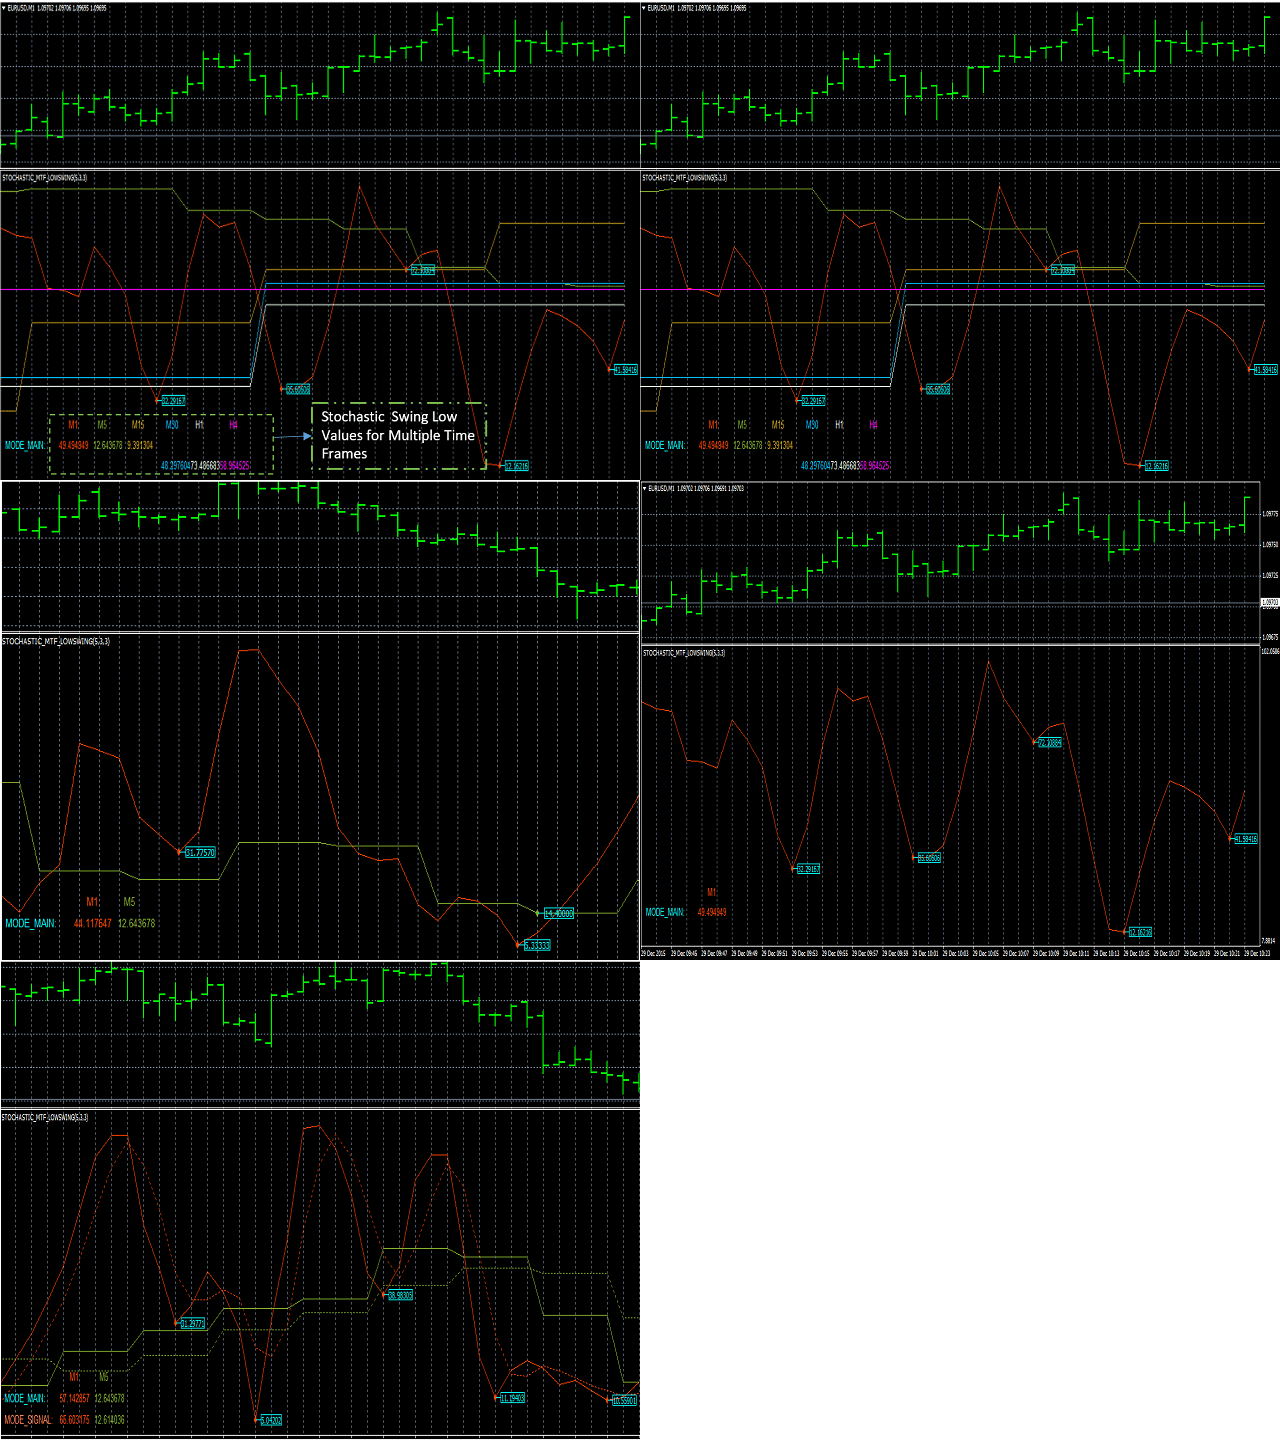
Stochastic Swing Low Multi Time Frame Indicator
https://www.mql5.com/en/market/product/13921
It supports multiple time frames i.e. by attaching the indicator on a single chart one can see the Stochastic Swing Low values for all the other time frames on a single chart.
https://www.mql5.com/en/market/product/13921
It supports multiple time frames i.e. by attaching the indicator on a single chart one can see the Stochastic Swing Low values for all the other time frames on a single chart.

Satyam Shivam
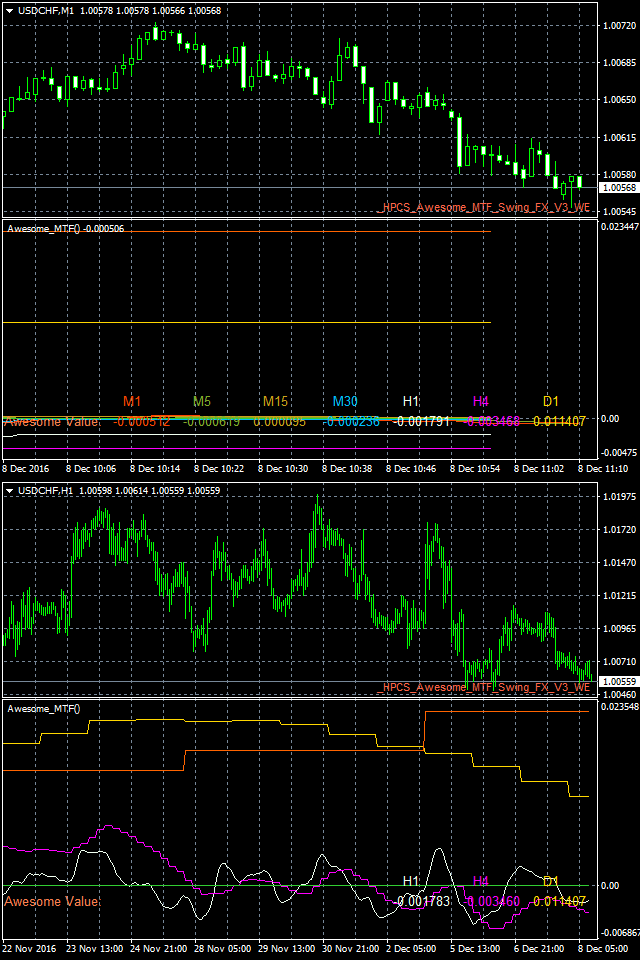
Awesome Swing Multi Time Frame Indicator
https://www.mql5.com/en/market/product/19798
Awesome Swing Multi Time Frame Indicator is one of the most advanced indicators based on both Swing and Awesome indicator trading strategies.
https://www.mql5.com/en/market/product/19798
Awesome Swing Multi Time Frame Indicator is one of the most advanced indicators based on both Swing and Awesome indicator trading strategies.

Satyam Shivam
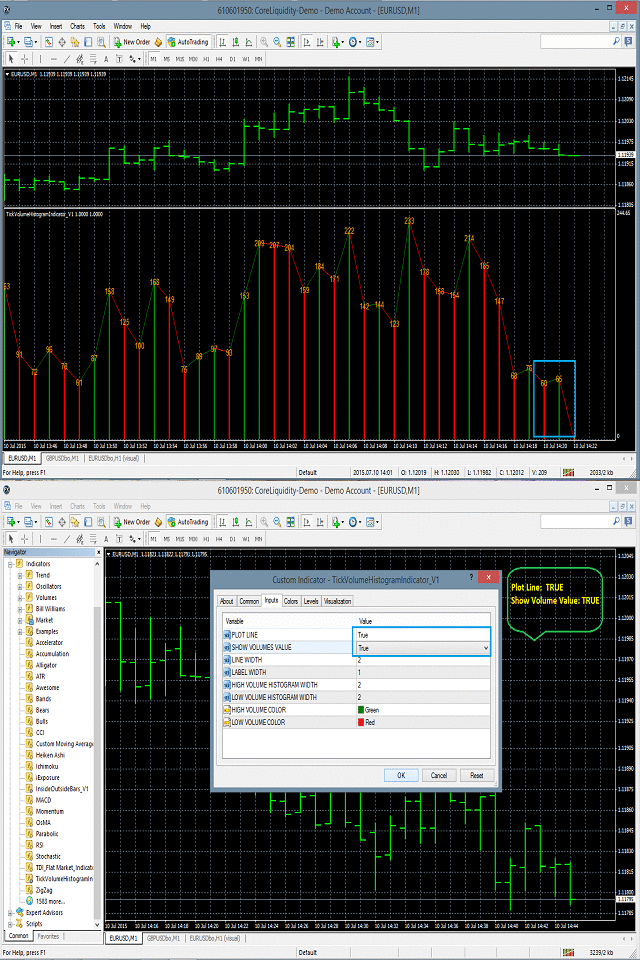
Tick Volume Histogram Indicator
https://www.mql5.com/en/market/product/10517
Tick Volume Histogram indicator is drawn in the separate window of the chart.
It basically displays the number of ticks at the peak of the histogram drawn in the separate window.
https://www.mql5.com/en/market/product/10517
Tick Volume Histogram indicator is drawn in the separate window of the chart.
It basically displays the number of ticks at the peak of the histogram drawn in the separate window.

Satyam Shivam
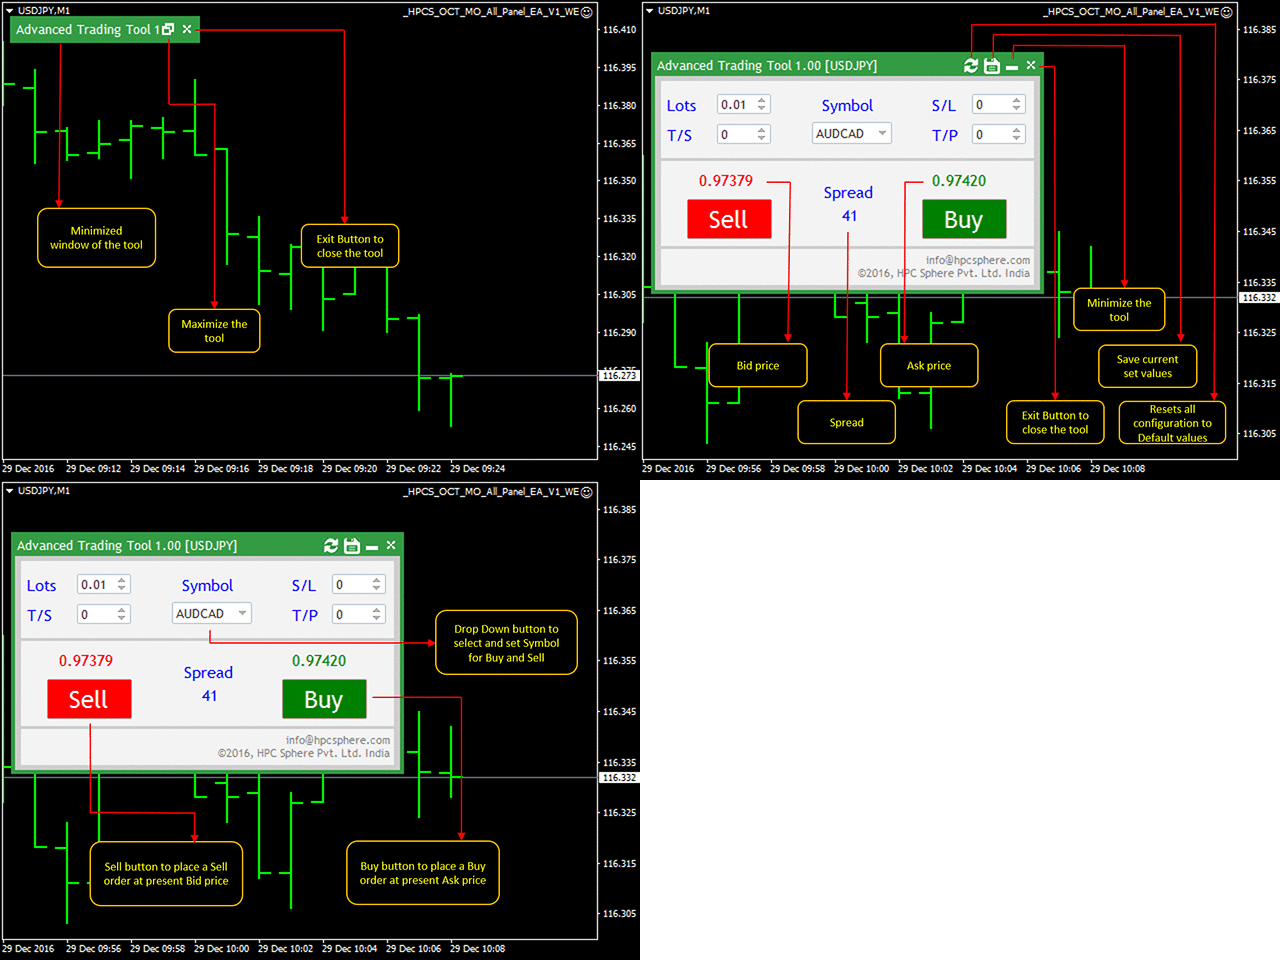
HP Market Order Panel
https://www.mql5.com/en/market/product/23843
This panel is an advanced panel which can be used to place buy/sell orders with live bid/ask price and spread.
This panel is very useful for the traders who wish to save their configurations and reset them with the use of simple buttons.
https://www.mql5.com/en/market/product/23843
This panel is an advanced panel which can be used to place buy/sell orders with live bid/ask price and spread.
This panel is very useful for the traders who wish to save their configurations and reset them with the use of simple buttons.

Satyam Shivam
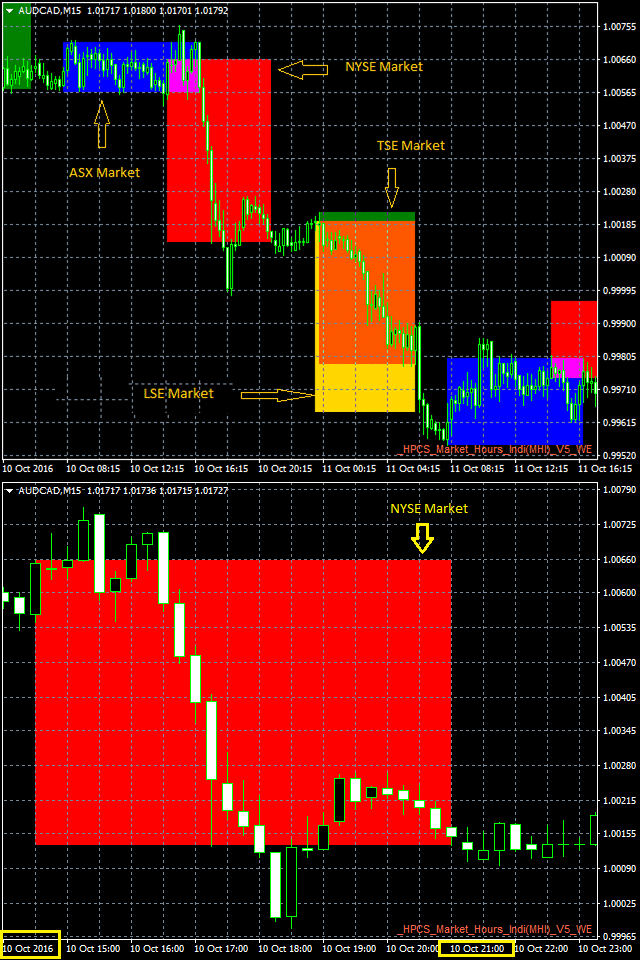
Market Hour Indicator
https://www.mql5.com/en/market/product/19736
Market Hour Indicator is one the most useful indicators for the traders who trade in different markets. The indicator highlights the area in the chart during which a particular market is open. It operates on four different markets i.e. New York Stock Exchange, Australian Stock Exchange, Tokyo Stock Exchange and London Stock Exchange.

Satyam Shivam
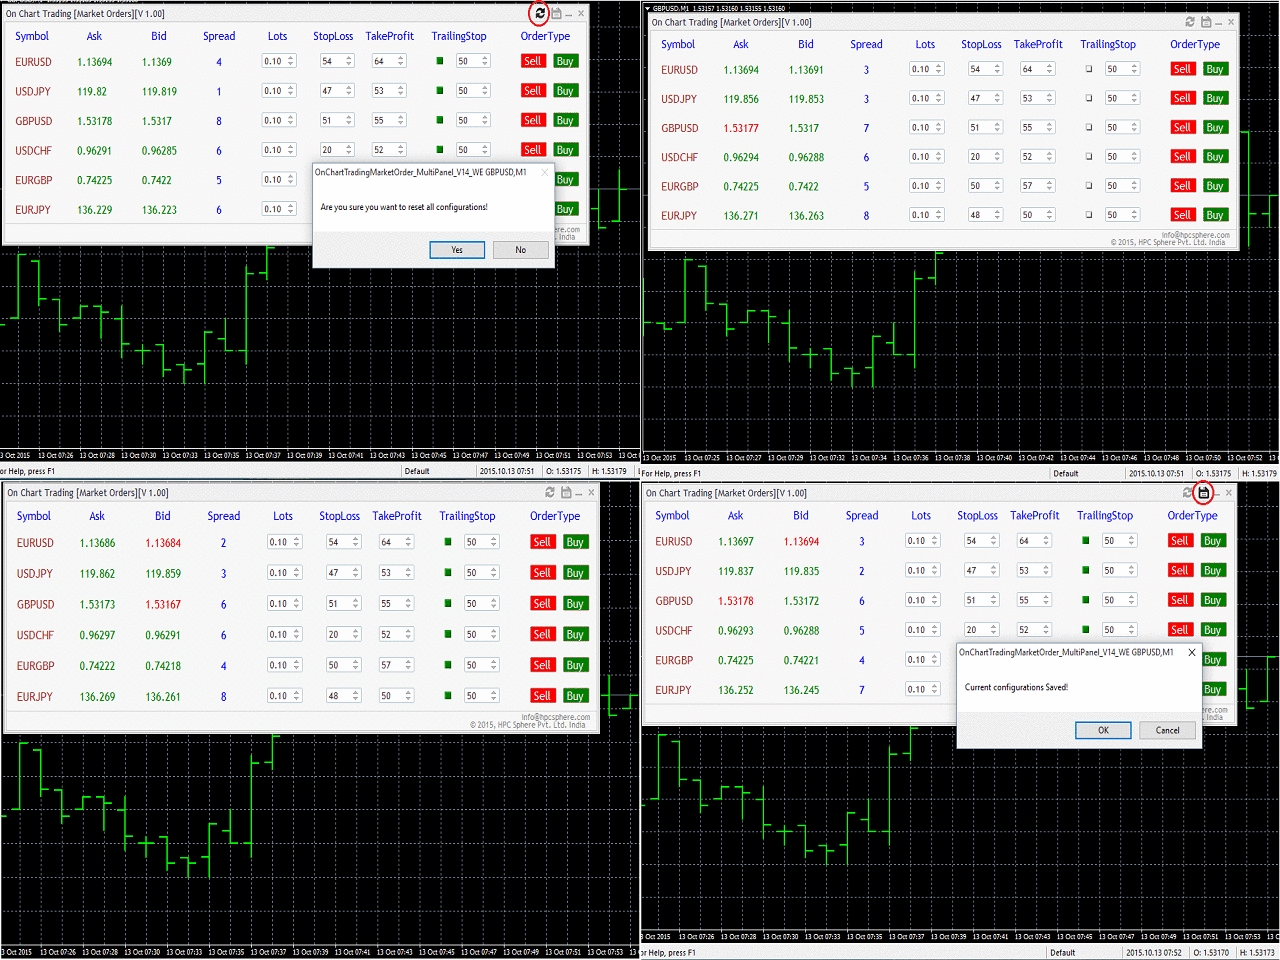
HPC Easy Spread Digger Trade Pad
https://www.mql5.com/en/market/product/12299
This panel is useful for traders dealing with several major symbols at one place (EURUSD, USDJPY, GBPUSD, USDCHF, EURGBP and EURJPY)
Traders can place orders for many symbols clicking a single button
Traders can see the live changes in the symbols (i.e., ask, bid, spread) values in this panel itself
Traders using the same configuration (inputs) for trading can save their configuration and can reset the configuration
Traders can place trades accordingly with the knowledge of live prices of the market and use buttons to simply place a buy/sell order.

Satyam Shivam
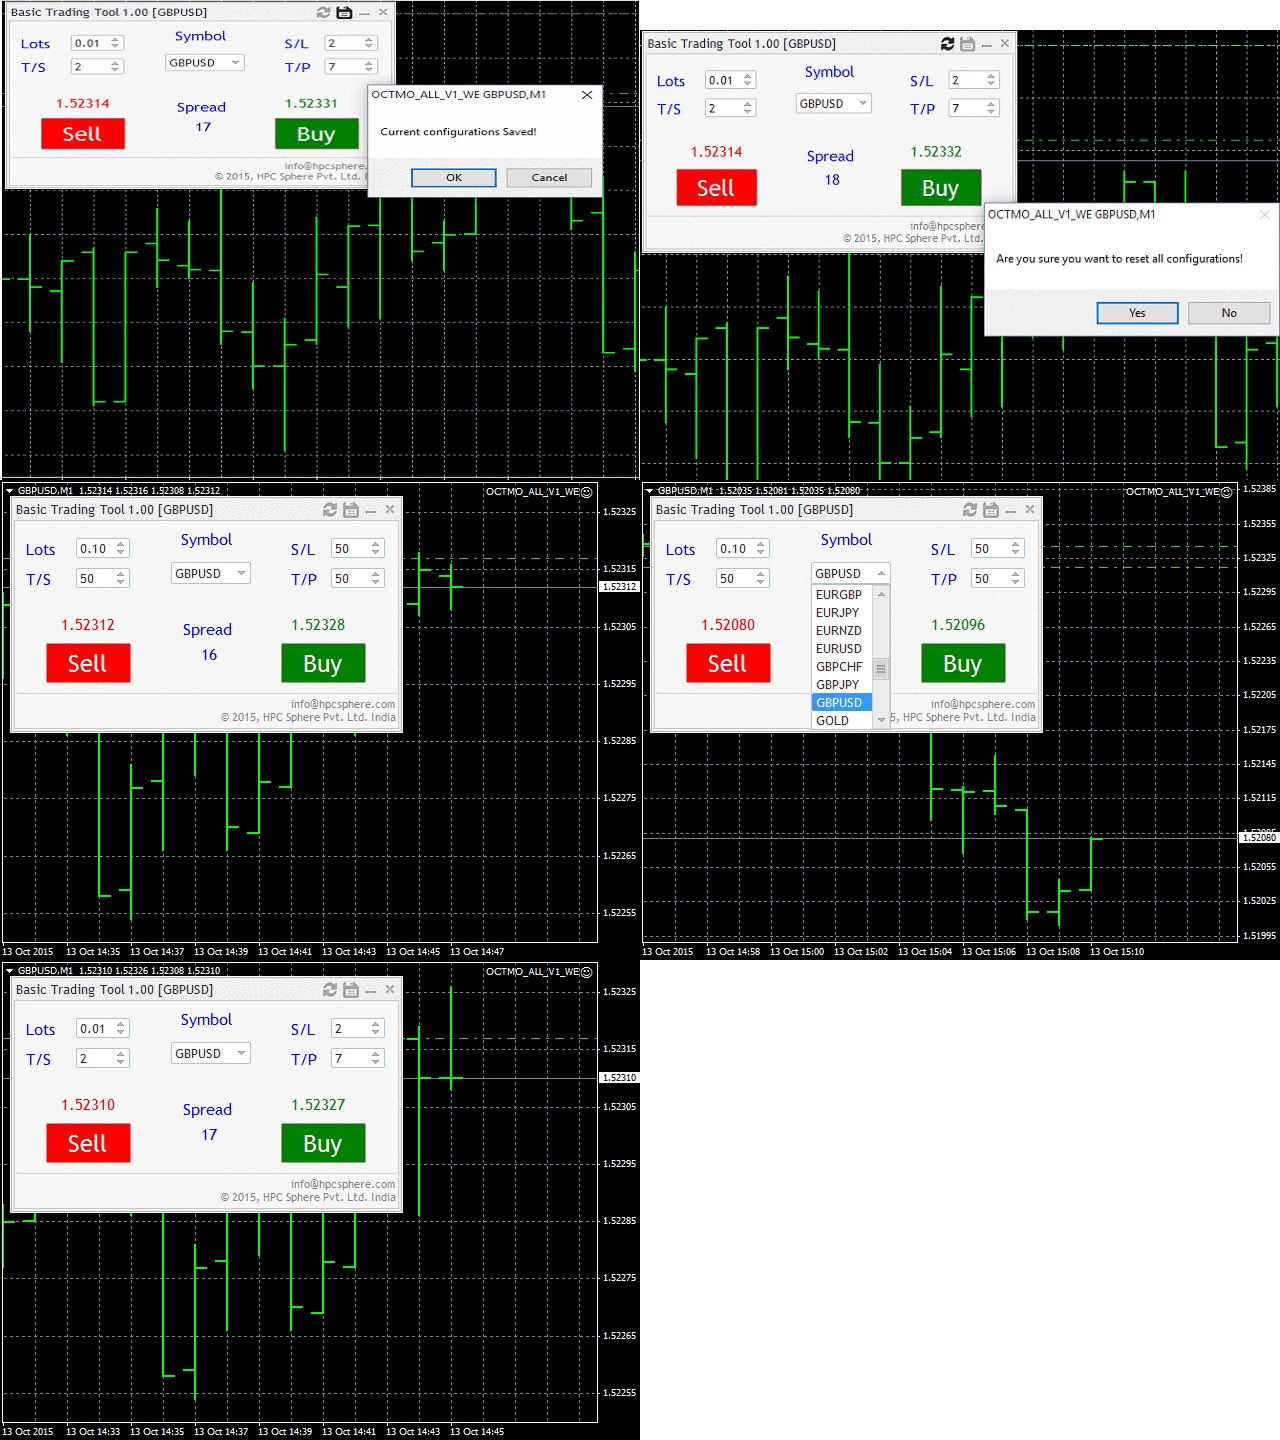
On Chart Trading Market Order Panel
https://www.mql5.com/en/market/product/12305
The user can choose from different market symbols. The lot size can be easily given along with the Stop Loss, Take Profit, Trailing Stop parameters. The user only needs to enter the above parameters and then either click on Sell or click on Buy.
https://www.mql5.com/en/market/product/12305
The user can choose from different market symbols. The lot size can be easily given along with the Stop Loss, Take Profit, Trailing Stop parameters. The user only needs to enter the above parameters and then either click on Sell or click on Buy.

Satyam Shivam
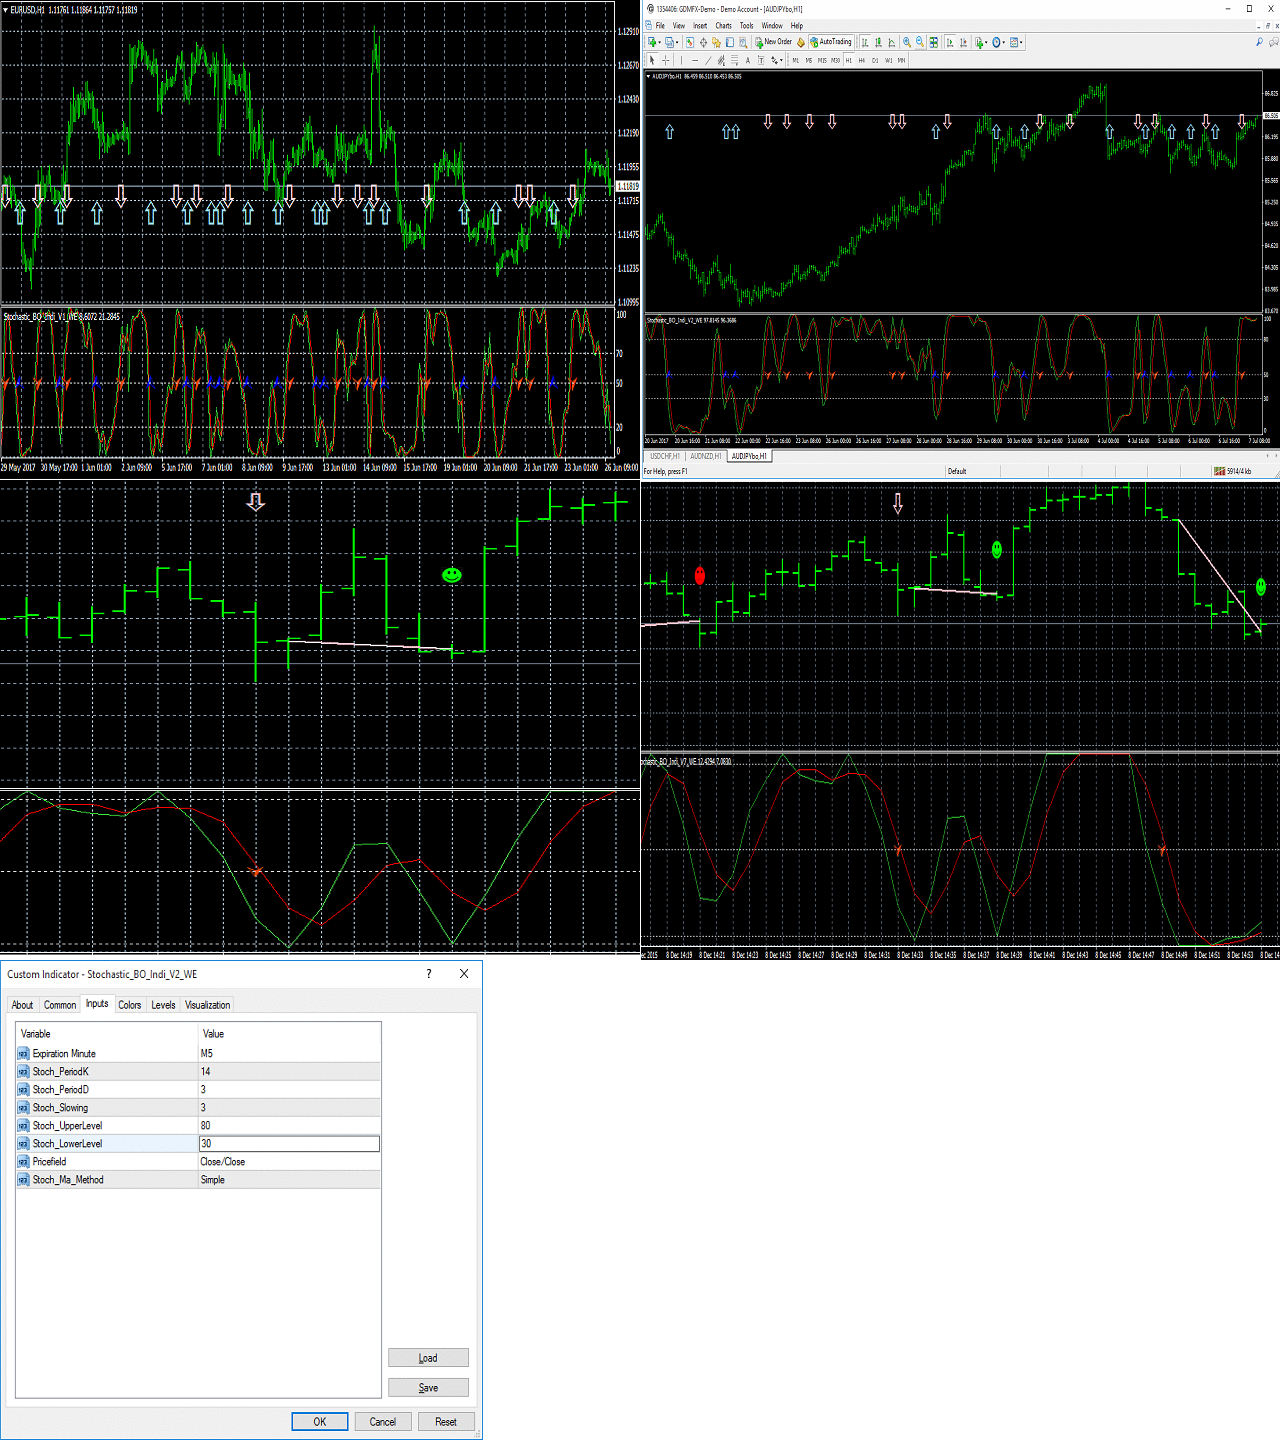
Stochastic Binary Option Indicator
https://www.mql5.com/en/market/product/13302
This indicator works on the binary options
• It uses stochastic strategy to indicate the upcoming trend of the market
• This indicator helps traders to place a trade with the prediction involved on the stochastic strategy.
• This indicator makes use of the symbols to indicate the prediction regarding the order.

Satyam Shivam
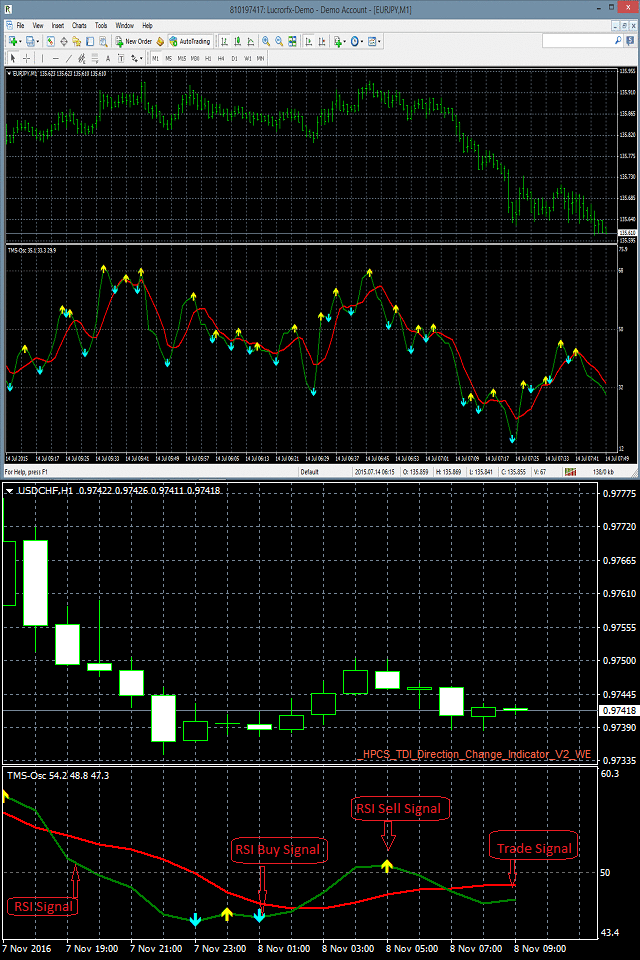
TDI Direction Change Indicator
https://www.mql5.com/en/market/product/10597
TDI Direction Change Indicator is an oscillator indicator which identifies the market entry point for placing trades by taking into consideration the values of RSI (Relative Strength Index), Trade Signal Method and Market Base Method.
https://www.mql5.com/en/market/product/10597
TDI Direction Change Indicator is an oscillator indicator which identifies the market entry point for placing trades by taking into consideration the values of RSI (Relative Strength Index), Trade Signal Method and Market Base Method.

Satyam Shivam
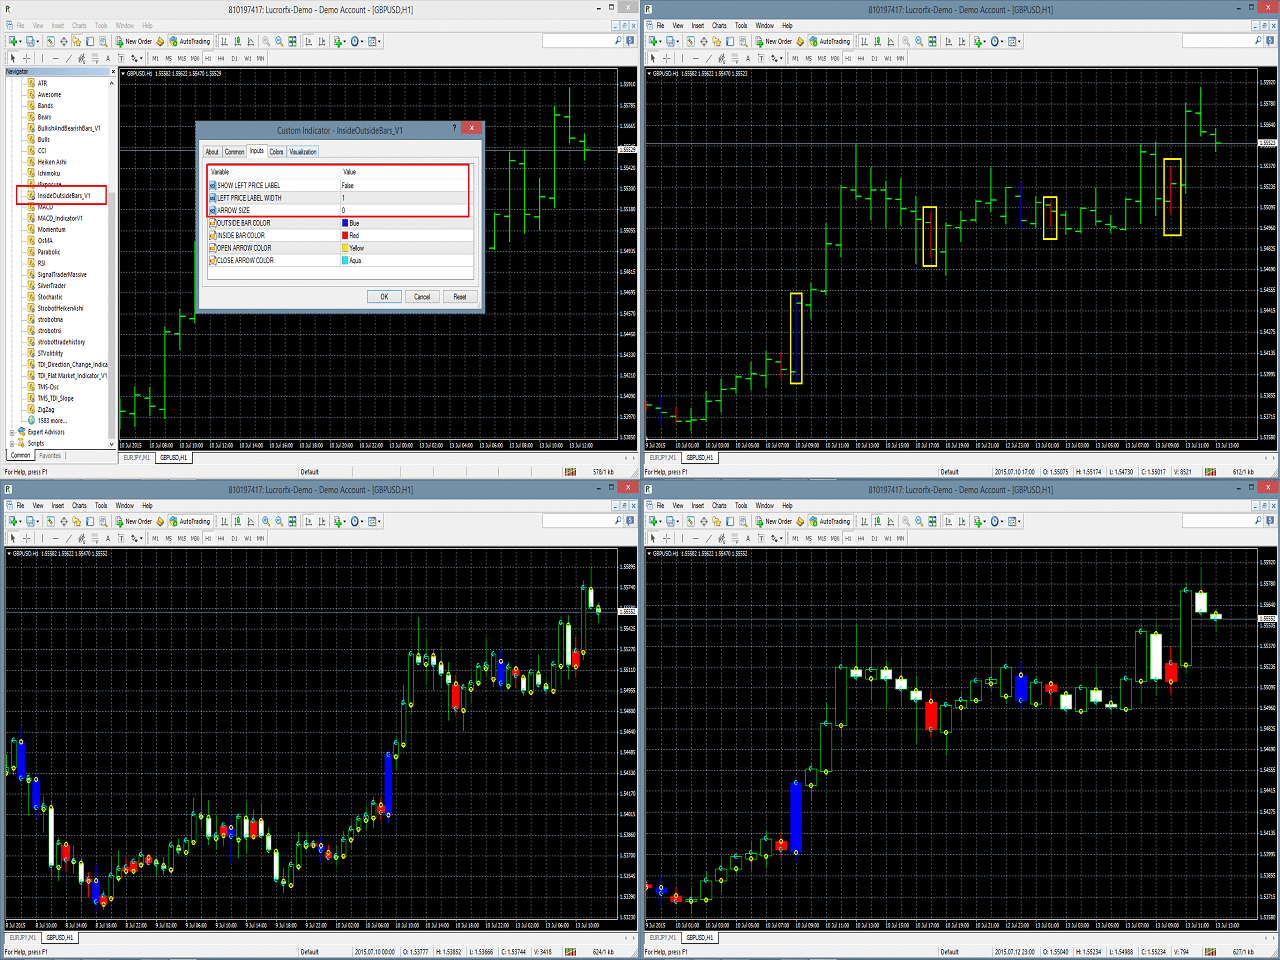
Inside Outside Bars Indicator
https://www.mql5.com/en/market/product/10588
The Inside Outside Bars indicator is drawn in the main window of the chart and displays them in different color with price label displaying on the left of the inside and outside bars.
https://www.mql5.com/en/market/product/10588
The Inside Outside Bars indicator is drawn in the main window of the chart and displays them in different color with price label displaying on the left of the inside and outside bars.

Satyam Shivam
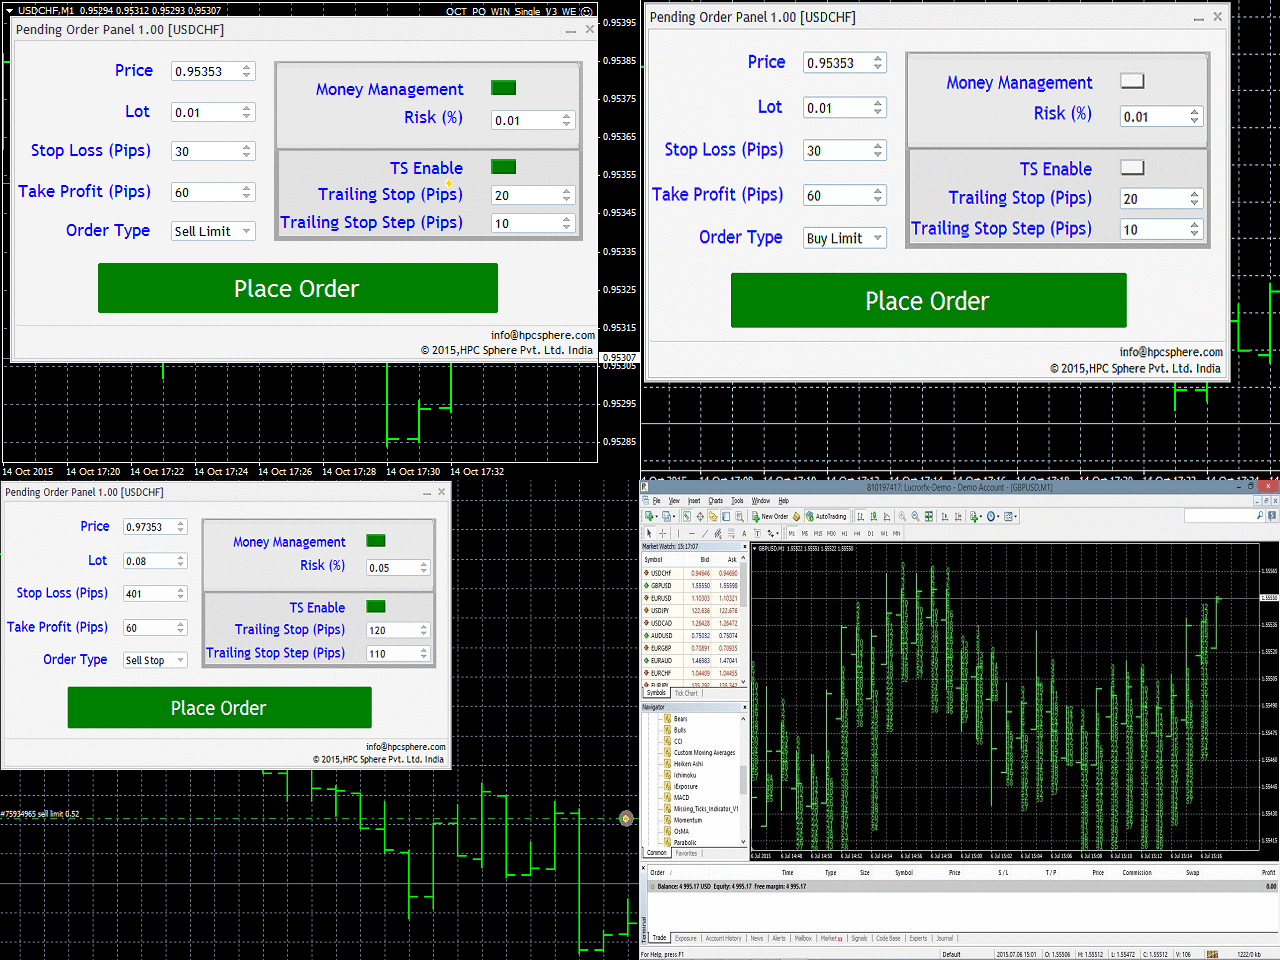
On Chart Trading Pending Order Window Single
https://www.mql5.com/en/market/product/12348
The expert advisor (EA) generates an on-chart trading panel to manually place any of four different types of pending order(s) on the attached chart's current symbol. Before clicking "Place" button, to place a pending order
https://www.mql5.com/en/market/product/12348
The expert advisor (EA) generates an on-chart trading panel to manually place any of four different types of pending order(s) on the attached chart's current symbol. Before clicking "Place" button, to place a pending order

Satyam Shivam
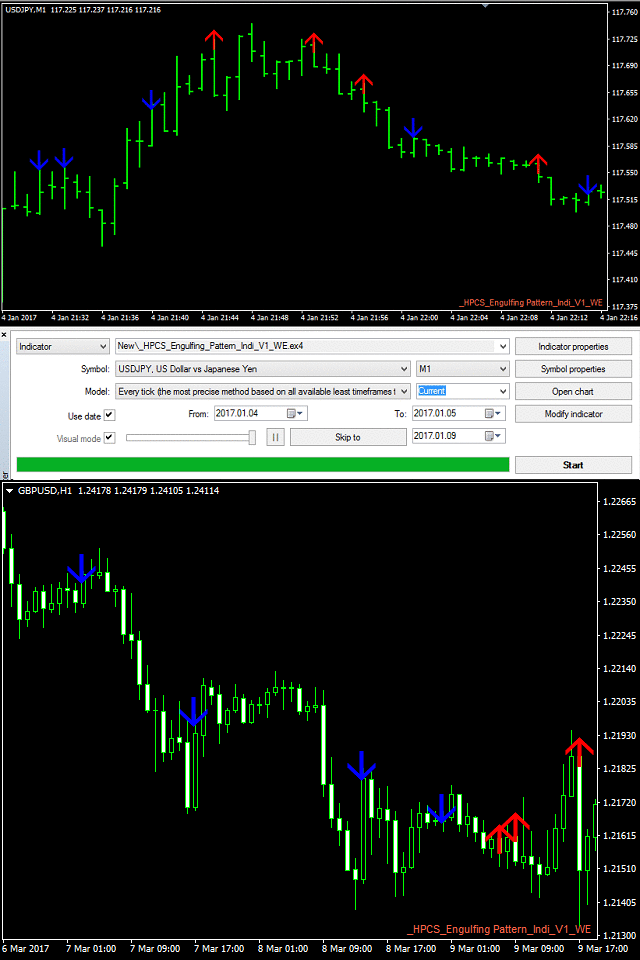
HP Engulfing Pattern Indicator
https://www.mql5.com/en/market/product/21927
This is a very simple indicator which identifies and displays engulfing pattern on the chart with the help of arrows.
https://www.mql5.com/en/market/product/21927
This is a very simple indicator which identifies and displays engulfing pattern on the chart with the help of arrows.

Satyam Shivam
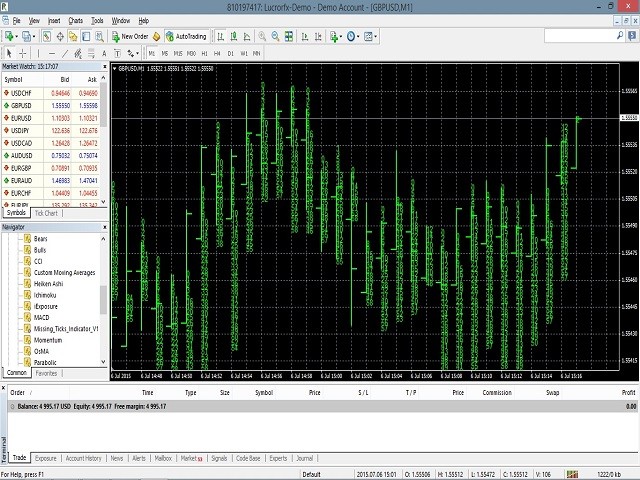
Missing Tick Indicator
https://www.mql5.com/en/market/product/10439
The indicator displays all those seconds, when no Tick was received for the current chart’s currency-pair.
These missing-tick seconds are displayed on the each bar. Besides, they are also printed inside "Experts" log, for post data-analysis.
The missing-tick seconds counter resets after each minute. Thus, it works well for any currency-pair in M1 timeframe.

Satyam Shivam
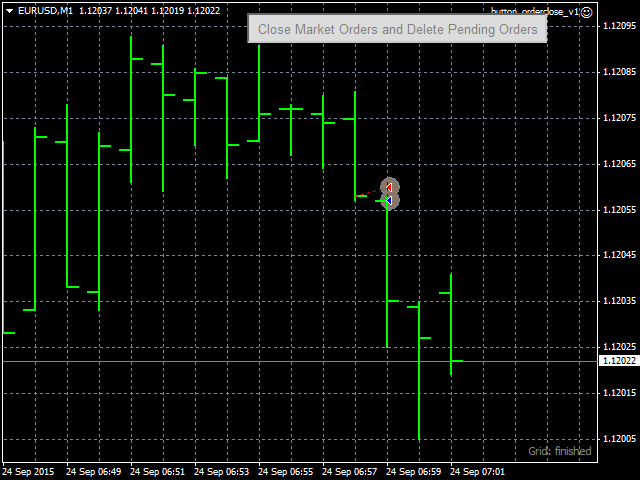
Button Order Close
https://www.mql5.com/en/market/product/10559
This expert advisor (EA) creates a button on top-right corner of the chart. Whenever this button is pressed, the EA closes all open market orders and deletes all pending orders for the currency-pair that is currently attached on the chart.
https://www.mql5.com/en/market/product/10559
This expert advisor (EA) creates a button on top-right corner of the chart. Whenever this button is pressed, the EA closes all open market orders and deletes all pending orders for the currency-pair that is currently attached on the chart.

Satyam Shivam
Triangular Arbitrage Indicator
https://www.mql5.com/en/market/product/15095
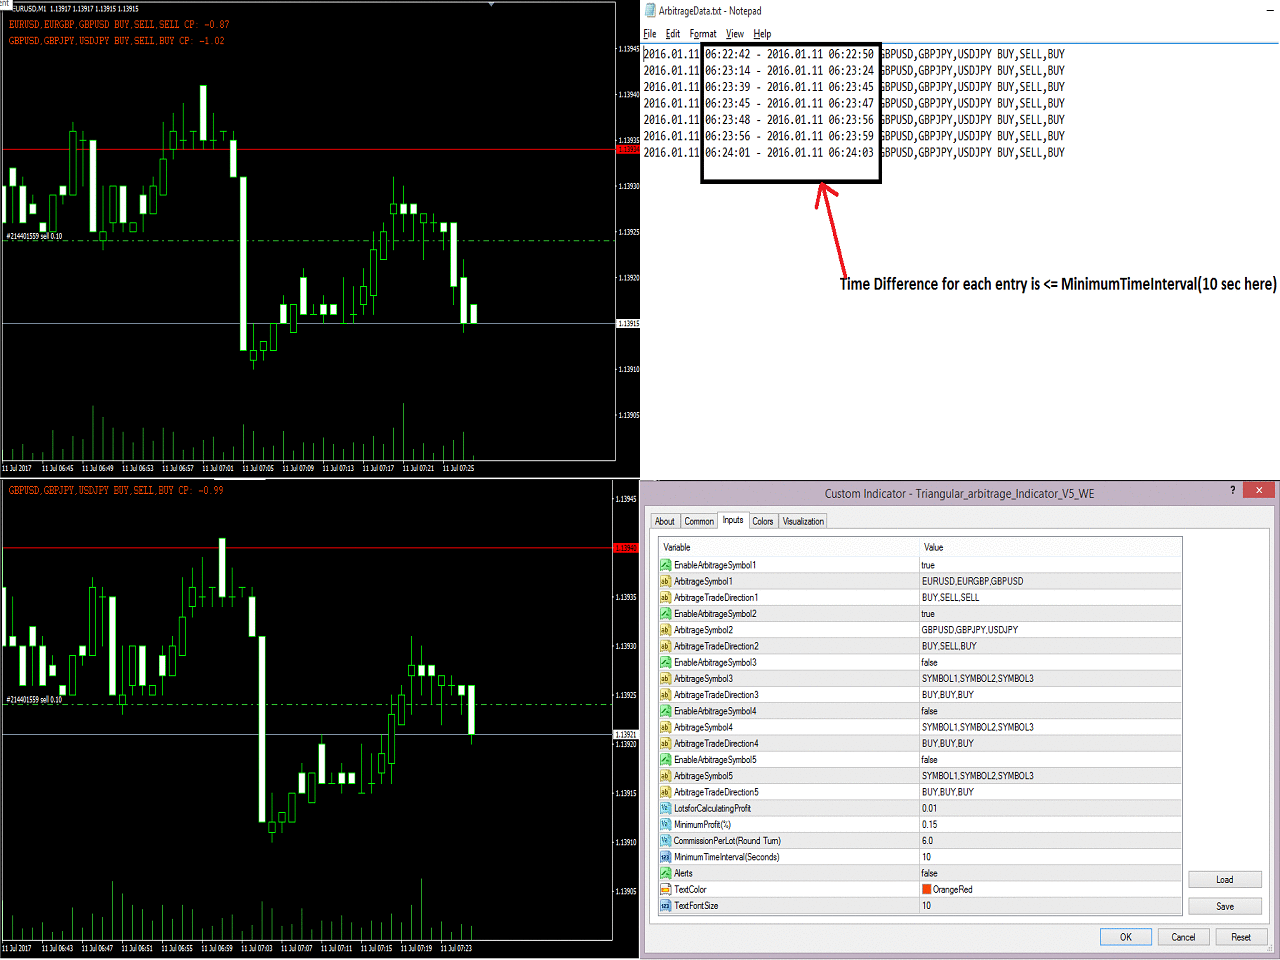
Triangular Arbitrage Indicator is one the most advance and efficient indicator available based on triangular arbitrage concept. Its complex algorithm calculates the profit based on different input parameters and shows directly on the chart. Also, if the minimum profit is retained for the minimum time interval (see input parameter sections) then that particular asset is written in a text file.

Satyam Shivam
TDI Flat Market Indicator
https://www.mql5.com/en/market/product/10450
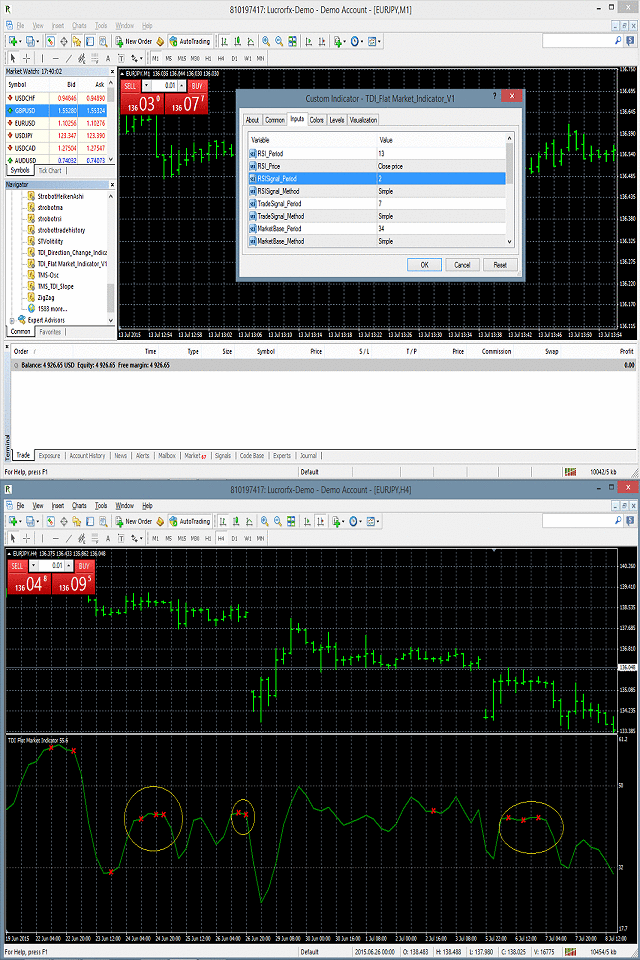
TDI Flat Market Indicator is an oscillator indicator which works in a separate window. It is based on RSI (Relative Strength Index), Trade Signal Method and Market Base Method. It identifies the flat market behavior which helps in determining when to enter the market.

Satyam Shivam
MACD Swing Low Multi Time Frame Indicator
https://www.mql5.com/en/market/product/13283
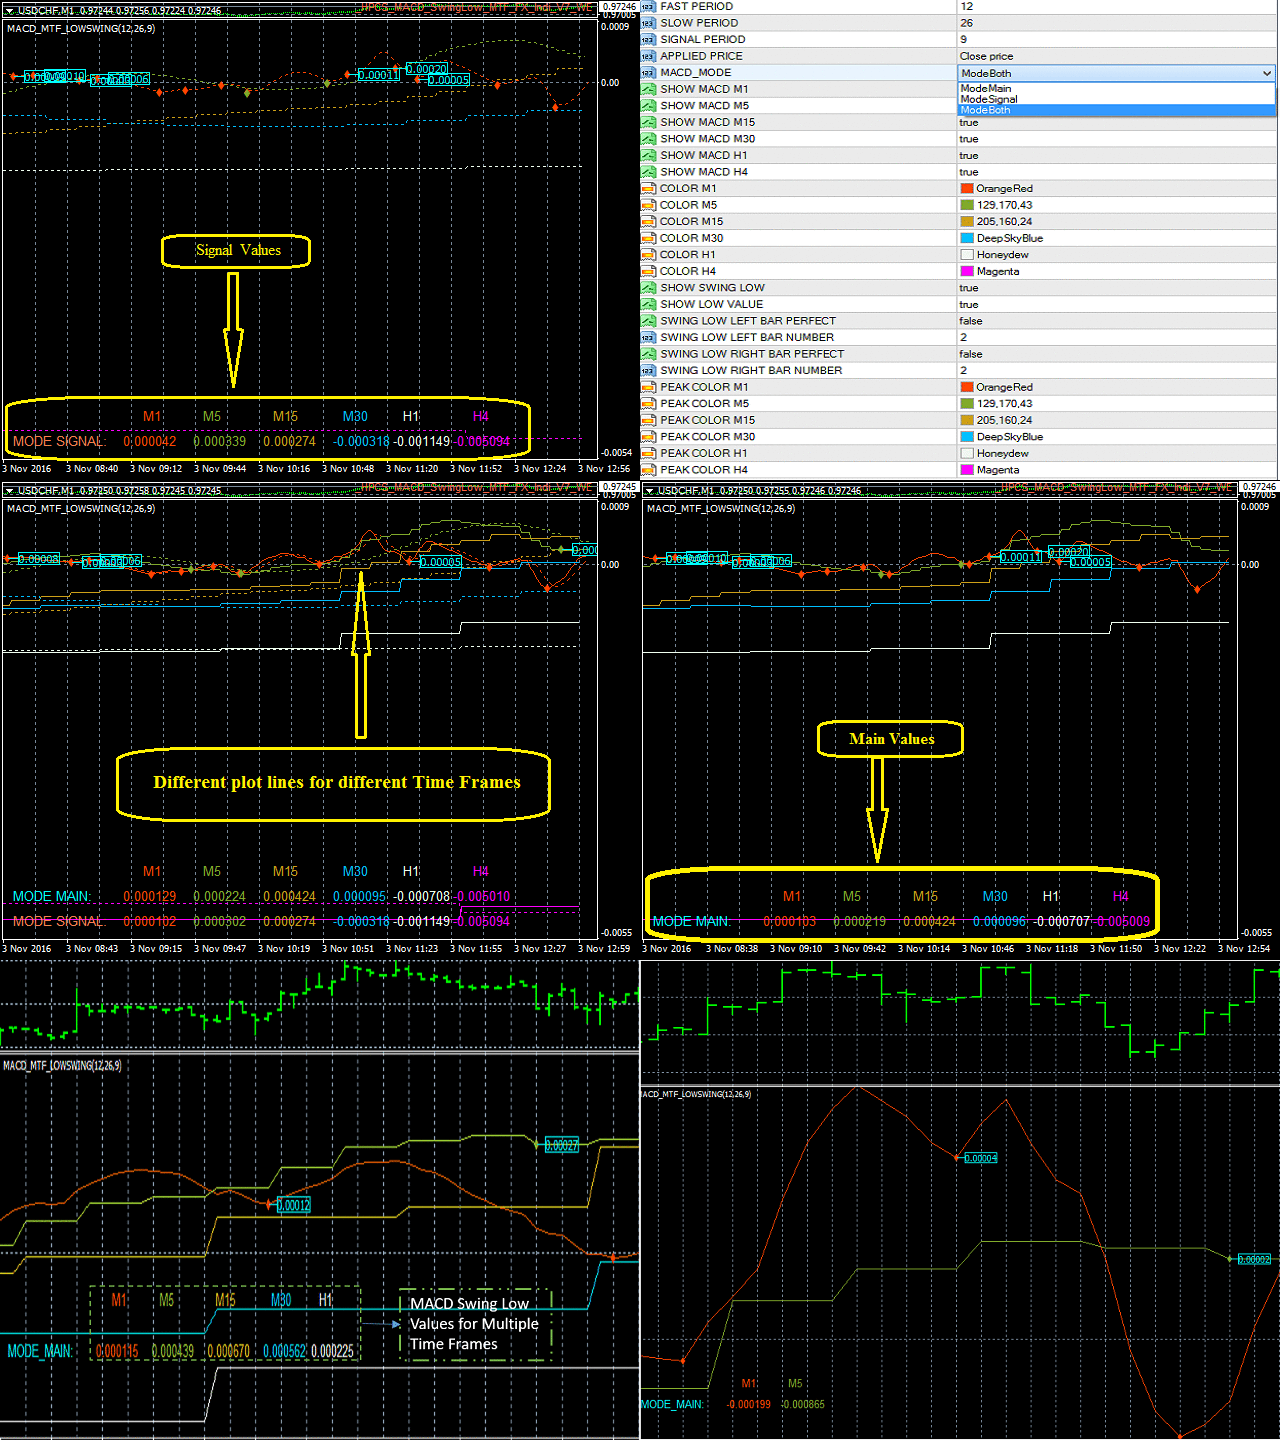
MACD Swing Low Multi Time Frame Indicator is one of the most advanced indicators based on both Swing Low and MACD trading strategies. It supports multiple timeframes, i.e. by attaching the indicator on a single chart, one can see the MACD Swing Low values for all the other timeframes on a single chart. One would just have to select the timeframes, for which he wants to see the calculated values.

Satyam Shivam
RSI Swing Low Multi Time Frame Indicator
https://www.mql5.com/en/market/product/13877
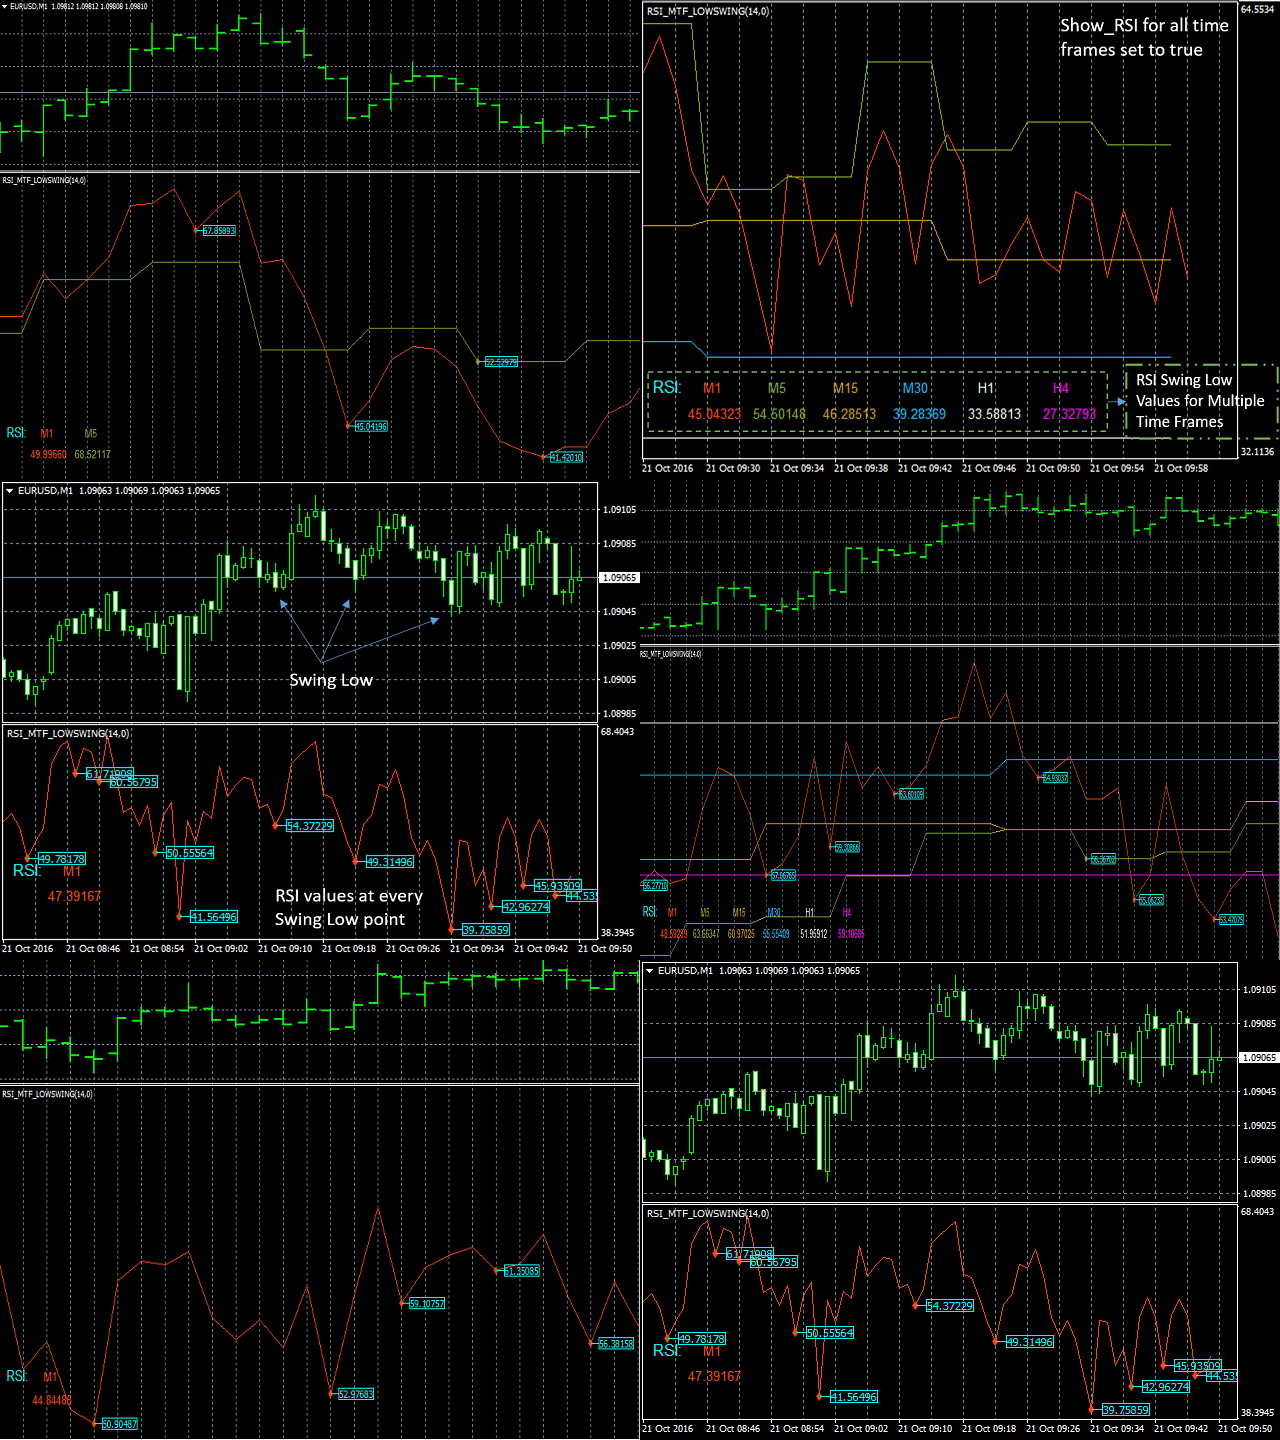
It supports multiple time frames i.e. by attaching the indicator on a single chart one can see the RSI Swing Low values for all the other time frames on a single chart.
https://www.mql5.com/en/market/product/13877
It supports multiple time frames i.e. by attaching the indicator on a single chart one can see the RSI Swing Low values for all the other time frames on a single chart.

: