Sergei Gurov / 販売者
パブリッシュされたプロダクト

Advanced Trading Chaos The main purpose of the indicator is to help the trader detect the signals described by Bill Williams in his books to make a quick and correct trading decision.
1)Bullish/Bearish Reversal Bar(BDB) 2) Divergent Bar(DB) 3) Second Sage Signal — the third consecutive Awesome Oscillator bar 4) Working fractals (Fractals that worked above/below the red forehead 5) Three bar coloring modes
5.1) Coloring of bars according to the AO indicator (Including the squatting bar)
5.2

A tool for creating Bill Williams indicators Our tool provides the ability to set Bill Williams indicators on a chart with a mouse click. - The Awesome Oscillator (AO) indicator helps to assess the driving force of the trend. - Alligator indicator — determines the current state of the trend and possible entry and exit points. - Fractals indicator — helps to identify significant levels - Accelerator Oscillator (AC) indicator — shows the change in trend acceleration. - Market Facilitation Index
FREE

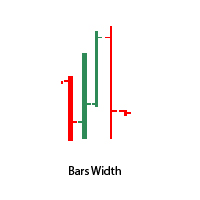
This indicator will allow you to change the thickness of the lines and the stroke color, due to which you can get a thicker bar on the chart. By default, the indicator has a bar thickness of 2. There is also an option in the input parameters to select the color of the bullish and bearish bars. When an indicator is added to the chart, the chart immediately changes its rendering style to "bar".
FREE

A Logarithmic AO indicator has been created for fans of trading on large timeframes
The standard AO indicator takes into account the price change, not its percentage ratio. If we translate the indicator into a logarithmic scale, we will see that often the indicators of the logarithmic driving force differ from the indicators of the driving force in the usual scale. This difference is visible on large timeframes.
On small timeframes, this is still the same standard AO indicator
Update added

A Logarithmic AС indicator has been created for fans of trading on large timeframes
The standard AС indicator takes into account the price change, not its percentage ratio. If we translate the indicator into a logarithmic scale, we will see that often the indicators of the logarithmic driving force differ from the indicators of the driving force in the usual scale. This difference is visible on large timeframes.
On small timeframes, this is still the same standard AС indicator
This indica

The Trading Chaos Panel trading utility is a trading panel designed to implement the unique principles of the Trading Chaos strategy, which combines elements of market trend analysis, risk management, and a psychological approach to trading. It consists of 5 blocks, each of which has its own functionality. The panel is also partially integrated into Telegram. User Manual The trading panel consists of 5 blocks 1st block. "Morning pages". The 2nd block is the "Screenshot Block". 3rd block "Waves

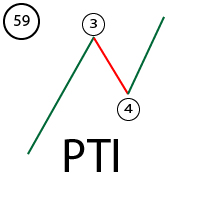
PTI is an index developed by Tom Joseph, which compares the points of Purchase/Third Wave Sales with a Buying Momentum/Sales of The Fourth Wave. This comparison will then be transferred to an algorithm that calculates the VALUE of the PTI INDEX. You can learn more about this index by reading his book Simplified Wave Analysis.
This indicator is an example of my understanding of this index.
This index should be used as follows: 1) You need to click on the "Start Calculation" chart 2) Make the