Young Ho Seo / プロファイル
- 情報
|
11+ 年
経験
|
62
製品
|
1190
デモバージョン
|
|
4
ジョブ
|
0
シグナル
|
0
購読者
|
Harmonic Pattern Indicator - Repainting + Japanese Candlestick Pattern Scanner + Automatic Channel + Many more
https://www.mql5.com/en/market/product/4488
https://www.mql5.com/en/market/product/4475
https://algotrading-investment.com/portfolio-item/harmonic-pattern-plus/
Non Repainting and Non Lagging Harmonic Pattern Indicator – Customizable Harmonic + Japanese Candlestic Pattern Scanner + Advanced Channel + Many more
https://www.mql5.com/en/market/product/41993
https://www.mql5.com/en/market/product/41992
https://algotrading-investment.com/portfolio-item/profitable-pattern-scanner/
Supply Demand Indicator – Multiple Timeframe Scanning Added + Non Repainting + Professional Indicator
https://www.mql5.com/en/market/product/40076
https://www.mql5.com/en/market/product/40075
https://algotrading-investment.com/portfolio-item/ace-supply-demand-zone/
Momentum Indicator – Path to Volume Spread Analysis
https://www.mql5.com/en/market/product/30641
https://www.mql5.com/en/market/product/30621
https://algotrading-investment.com/portfolio-item/excessive-momentum-indicator/
Elliott Wave Indicator for the Power User
https://www.mql5.com/en/market/product/16479
https://www.mql5.com/en/market/product/16472
https://algotrading-investment.com/portfolio-item/elliott-wave-trend/
Forex Prediction - Turn Support and Resistance to the Advanced Strategy
https://www.mql5.com/en/market/product/49170
https://www.mql5.com/en/market/product/49169
https://algotrading-investment.com/portfolio-item/fractal-pattern-scanner/
MetaTrader 4 and MetaTrader 5 Product Page: https://www.mql5.com/en/users/financeengineer/seller#products
Free Forex Prediction with Fibonacci Analysis: https://algotrading-investment.com/2020/10/23/forex-prediction-with-fibonacci-analysis/
Free Harmonic Pattern Signal: https://algotrading-investment.com/2020/12/17/harmonic-pattern-signal-for-forex-market/
============================================================================================================================
Here are the trading education books. We recommend reading these books if you are a trader or investor in Forex and Stock market. In the list below, we put the easy to read book on top. Try to read the easy to read book first and try to read the harder book later to improve your trading and investment.
First Link = amazon.com, Second Link = Google Play Books, Third Link = algotrading-investment.com, Fourth Link = Google Books
Technical Analysis in Forex and Stock Market (Supply Demand Analysis and Support Resistance)
https://www.amazon.com/dp/B09L55ZK4Z
https://play.google.com/store/books/details?id=pHlMEAAAQBAJ
https://algotrading-investment.com/portfolio-item/technical-analysis-in-forex-and-stock-market/
https://books.google.co.kr/books/about?id=pHlMEAAAQBAJ
Science Of Support, Resistance, Fibonacci Analysis, Harmonic Pattern, Elliott Wave and X3 Chart Pattern (In Forex and Stock Market Trading)
https://www.amazon.com/dp/B0993WZGZD
https://play.google.com/store/books/details?id=MME3EAAAQBAJ
https://algotrading-investment.com/portfolio-item/science-of-support-resistance-fibonacci-analysis-harmonic-pattern/
https://books.google.co.kr/books/about?id=MME3EAAAQBAJ
Profitable Chart Patterns in Forex and Stock Market (Fibonacci Analysis, Harmonic Pattern, Elliott Wave, and X3 Chart Pattern)
https://www.amazon.com/dp/B0B2KZH87K
https://play.google.com/store/books/details?id=7KrQDwAAQBAJ
https://algotrading-investment.com/portfolio-item/profitable-chart-patterns-in-forex-and-stock-market/
https://books.google.com/books/about?id=7KrQDwAAQBAJ
Guide to Precision Harmonic Pattern Trading (Mastering Turning Point Strategy for Financial Trading)
https://www.amazon.com/dp/B01MRI5LY6
https://play.google.com/store/books/details?id=8SbMDwAAQBAJ
http://algotrading-investment.com/portfolio-item/guide-precision-harmonic-pattern-trading/
https://books.google.com/books/about?id=8SbMDwAAQBAJ
Scientific Guide to Price Action and Pattern Trading (Wisdom of Trend, Cycle, and Fractal Wave)
https://www.amazon.com/dp/B073T3ZMBR
https://play.google.com/store/books/details?id=5prUDwAAQBAJ
https://algotrading-investment.com/portfolio-item/scientific-guide-to-price-action-and-pattern-trading/
https://books.google.com/books/about?id=5prUDwAAQBAJ
Predicting Forex and Stock Market with Fractal Pattern: Science of Price and Time
https://www.amazon.com/dp/B086YKM8BW
https://play.google.com/store/books/details?id=VJjiDwAAQBAJ
https://algotrading-investment.com/portfolio-item/predicting-forex-and-stock-market-with-fractal-pattern/
https://books.google.com/books/about?id=VJjiDwAAQBAJ
Trading Education Book 1 in Korean (Apple, Google Play Book, Google Book, Scribd, Kobo)
https://books.apple.com/us/book/id1565534211
https://play.google.com/store/books/details?id=HTgqEAAAQBAJ
https://books.google.co.kr/books/about?id=HTgqEAAAQBAJ
https://www.scribd.com/book/505583892
https://www.kobo.com/ww/en/ebook/8J-Eg58EDzKwlpUmADdp2g
Trading Education Book 2 in Korean (Apple, Google Play Book, Google Book, Scribd, Kobo)
https://books.apple.com/us/book/id1597112108
https://play.google.com/store/books/details?id=shRQEAAAQBAJ
https://books.google.co.kr/books/about?id=shRQEAAAQBAJ
https://www.scribd.com/book/542068528
https://www.kobo.com/ww/en/ebook/X8SmJdYCtDasOfQ1LQpCtg
About Young Ho Seo
Young Ho Seo is an Engineer, Financial Trader, and Quantitative Developer, working on Trading Science and Investment Engineering since 2011. He is the creator of many technical indicators, price patterns and trading strategies used in the financial market. He is also teaching the trading practice on how to use the Supply Demand Analysis, Support, Resistance, Trend line, Fibonacci Analysis, Harmonic Pattern, Elliott Wave Theory, Chart Patterns, and Probability for Forex and Stock Market. His works include developing scientific trading principle and mathematical algorithm in the work of Benjamin Graham, Everette S. Gardner, Benoit Mandelbrot, Ralph Nelson Elliott, Harold M. Gartley, Richard Shabacker, William Delbert Gann, Richard Wyckoff and Richard Dennis. You can find his dedicated works on www.algotrading-investment.com . His life mission is to connect financial traders and scientific community for better understanding of this world and crowd behaviour in the financial market. He wrote many books and articles, which are helpful for understanding the technology and application behind technical analysis, statistics, time series forecasting, fractal science, econometrics, and artificial intelligence in the financial market.
If you are interested in our software and training, just visit our main website: www.algotrading-investment.com
Young Ho Seo
Ace Supply Demand Zone Indicator – How to Remove Take Profit and Stop Loss Levels
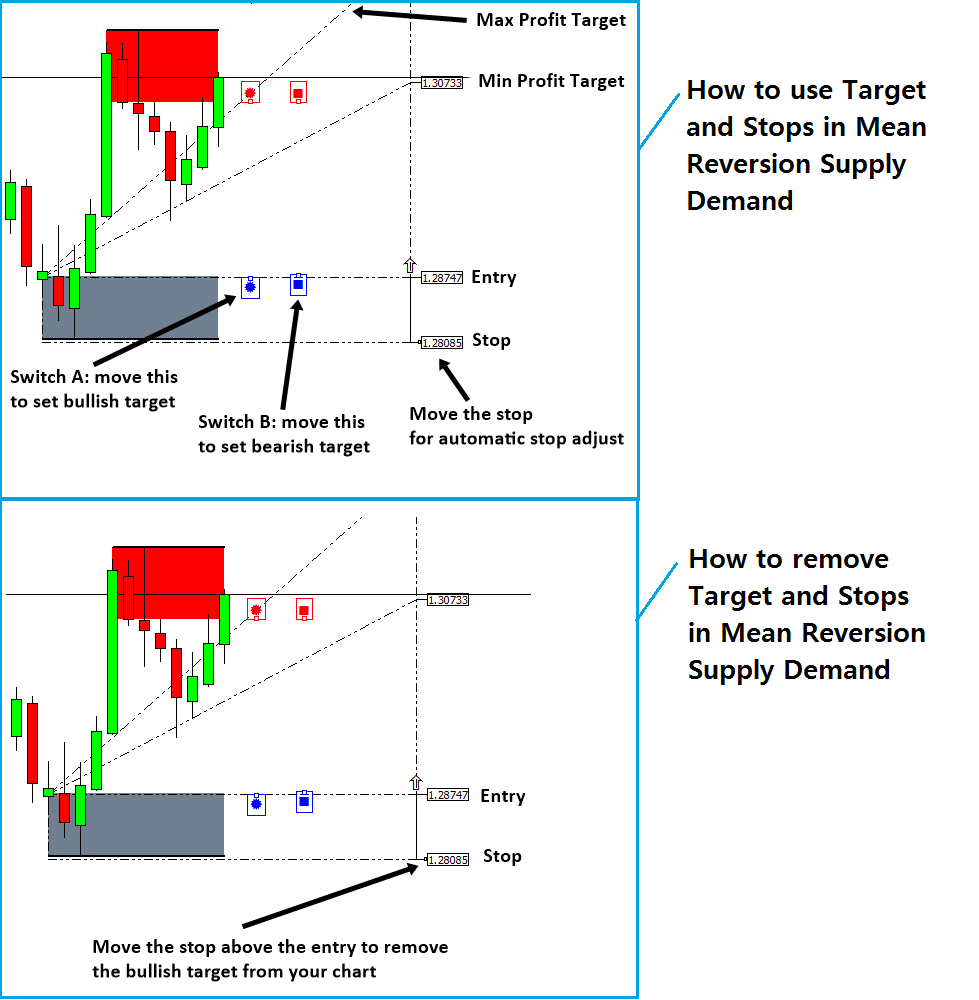
One of the greatest advantage of Ace Supply Demand Zone indicator is that it provide a flexible Profit and stop target for your trading. After you have learnt how to use this profit targets, now you want to learn how to remove them. Of course, there is a way to remove them. The trick is simply moving the stop text above the Entry text (for the case of buy). You will do the opposite for the case of sell. In the screenshot, the bottom image describe how to remove the targets from your chart.
There is another approach to remove take profit and stop loss targets. We provide the shortcut in keyboard for doing the same task. Simply hit “z” button in your keyboard. This will also remove the stop loss and take profit targets if you do not need them any longer.
Below is link to Ace Supply Demand Zone Indicator.
https://www.mql5.com/en/market/product/40076
https://www.mql5.com/en/market/product/40075
https://algotrading-investment.com/portfolio-item/ace-supply-demand-zone/

Young Ho Seo
Applying Turing Point Prediction in Forex Market
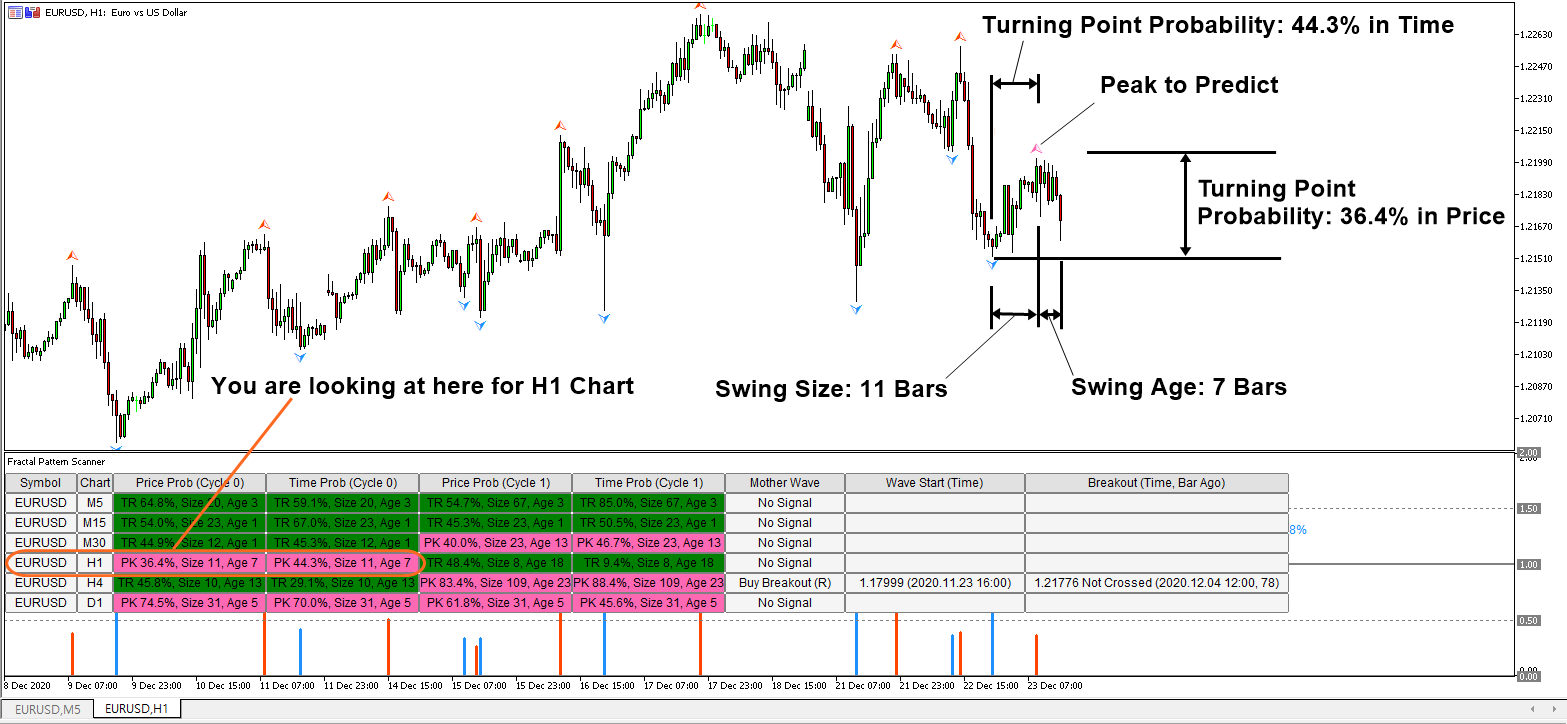
In this article, we provide an explanation on how to apply the turning point prediction in Forex Market. Here we will be using Swing Size and Swing Age variable to identify the turning point probability for each price swing.
Swing Age is the count of candle bars from latest bar to the swing right end.
Swing Size is the count of candle bars from the swing right end to swing left end
As these two variable provides you the relative coordinate of the right end and left end of the price swing, you can locate the turning point value for each price swing. Check the screenshot to clarify your understanding.
In terms of application, the turning point prediction is useful as it quantifies your risk for trading between 0.0 and 1.0 (or 100%). Quantification in your trading is always good because you have something to stick as a guidance for your trading. When you do not have the guidance, you will often find that your emotion will ruin your trading.
There are two basic concepts in regards to the probability and some advanced concepts in regards to Mother Wave and Child Wave. For your own good, everyone should understand the basic concepts if you want to improve your trading performance in long run.
In the first basic concept, if the price reaches the turning point probability above 0.7 (or 70%), in this turning point probability range, you can look for the potential reversal opportunity. In another words, it is the good point to detect the directional change in the market. It could be either correction or global turning point.
In the second basic concept, if the price reaches the turning point probability between 0.0 and 0.5 (or 50%), you can find the good breakout opportunity. In another words, it is the good point to detect the continuation in the price movement. We will omit the advanced concepts here as it was already explained elsewhere.
If you do not have an access to the Turning Point Prediction, then it is fine as we provide the Turning Point Prediction for Forex Market for free. Anyone can access the standard turning point prediction for your day trading for free of charge from the link below.
https://algotrading-investment.com/2020/10/23/price-prediction-for-day-trading/
At the same time, if you want to have the scanner for the MetaTrader 4 or MetaTrader 5, here is the links to Fractal Pattern Scanner. In Fractal Pattern Scanner, you can access the turning point probability scanner + mother wave breakout signals, reversal signals, and many more advanced features.
https://www.mql5.com/en/market/product/49170
https://www.mql5.com/en/market/product/49169
https://algotrading-investment.com/portfolio-item/fractal-pattern-scanner/

Young Ho Seo
Scan and search future harmonic patterns with Harmonic Pattern Scenario Planner
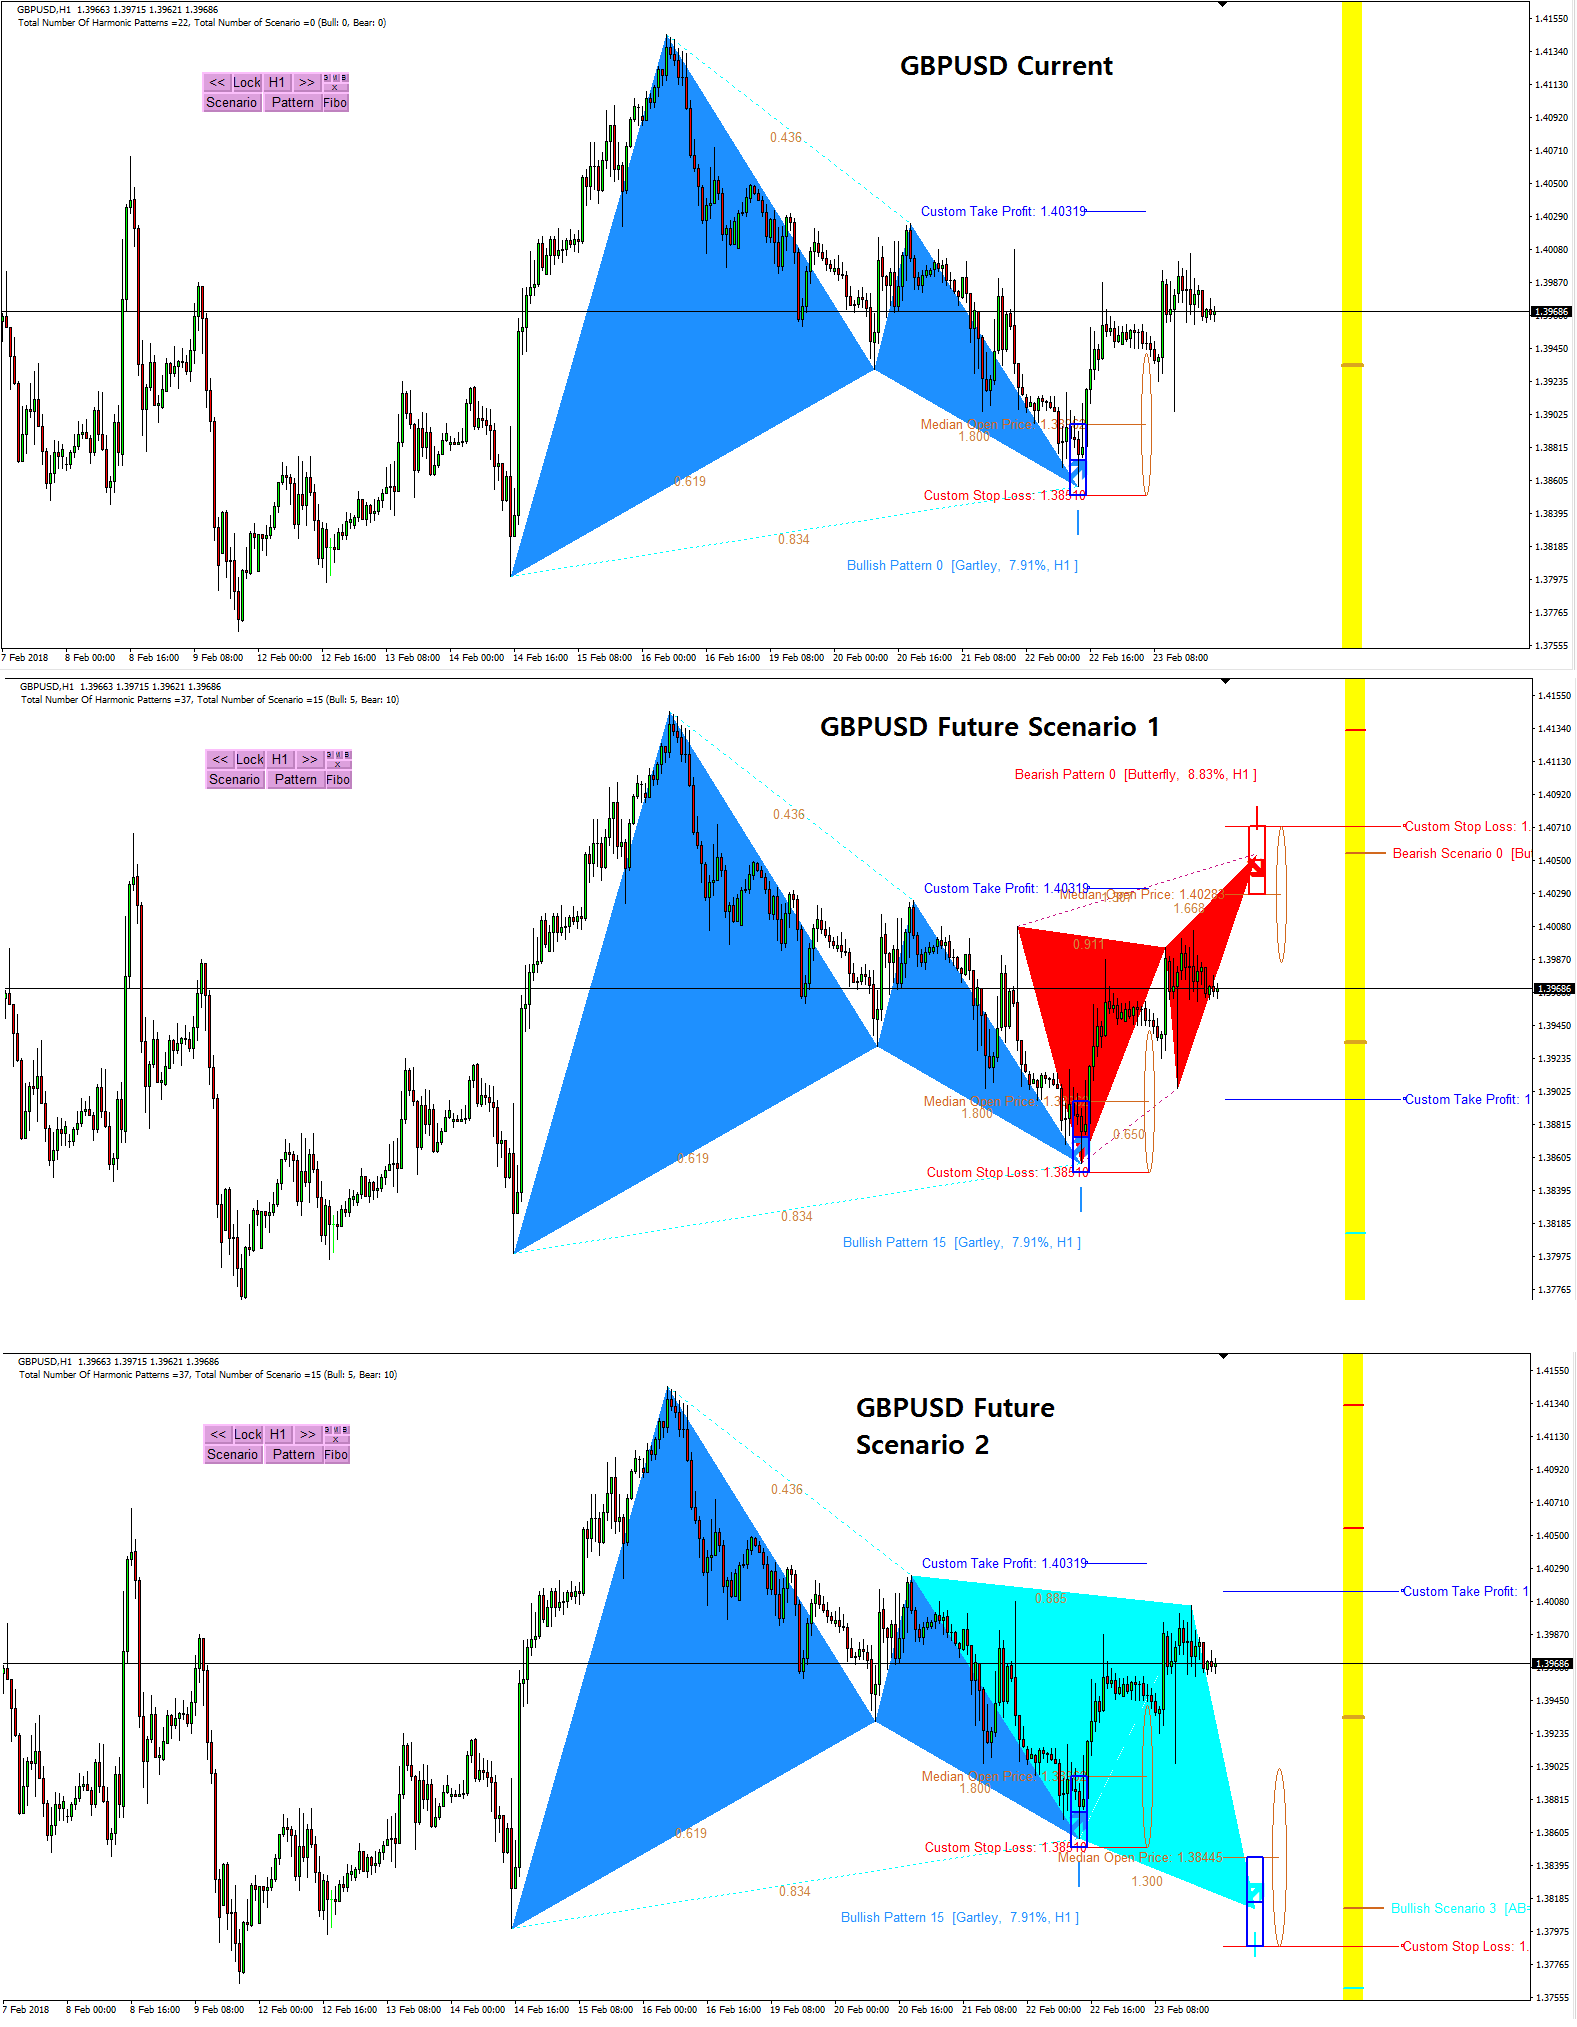
Harmonic Pattern Scenario Planner is a tool you can scan and search future harmonic patterns in just one button click. It would detect any potential future harmonic patterns in your search range using the algorithm like Monte Carlo simulation. You can even get the potential take profit and stop loss of the future patterns even before they form. What is even more, you can use all the features and functionality of harmonic pattern plus from your harmonic pattern scenario planner too.
Have watched this interesting movie called “Next” ? Check out the guy can see the few minutes into the futures. How powerful the 2 minutes vision for future is. Predicting future is very tactical game but it is hard because future keep changing based on the presents. However, it is definitely an interesting game. As a trader, you can gain a lot of advantage over other traders by predicting futures.
http://www.imdb.com/title/tt0435705/
This movie like predicting concept was equipped in our Harmonic Pattern Scenario Planner. check the power of predictive harmonic pattern for your trading. We are only one selling this future predictive harmonic pattern scanner in the universe.
https://algotrading-investment.com/portfolio-item/harmonic-pattern-scenario-planner/
https://www.mql5.com/en/market/product/6101
https://www.mql5.com/en/market/product/6240

Young Ho Seo
Introduction to Equilibrium Fractal Wave Analytics
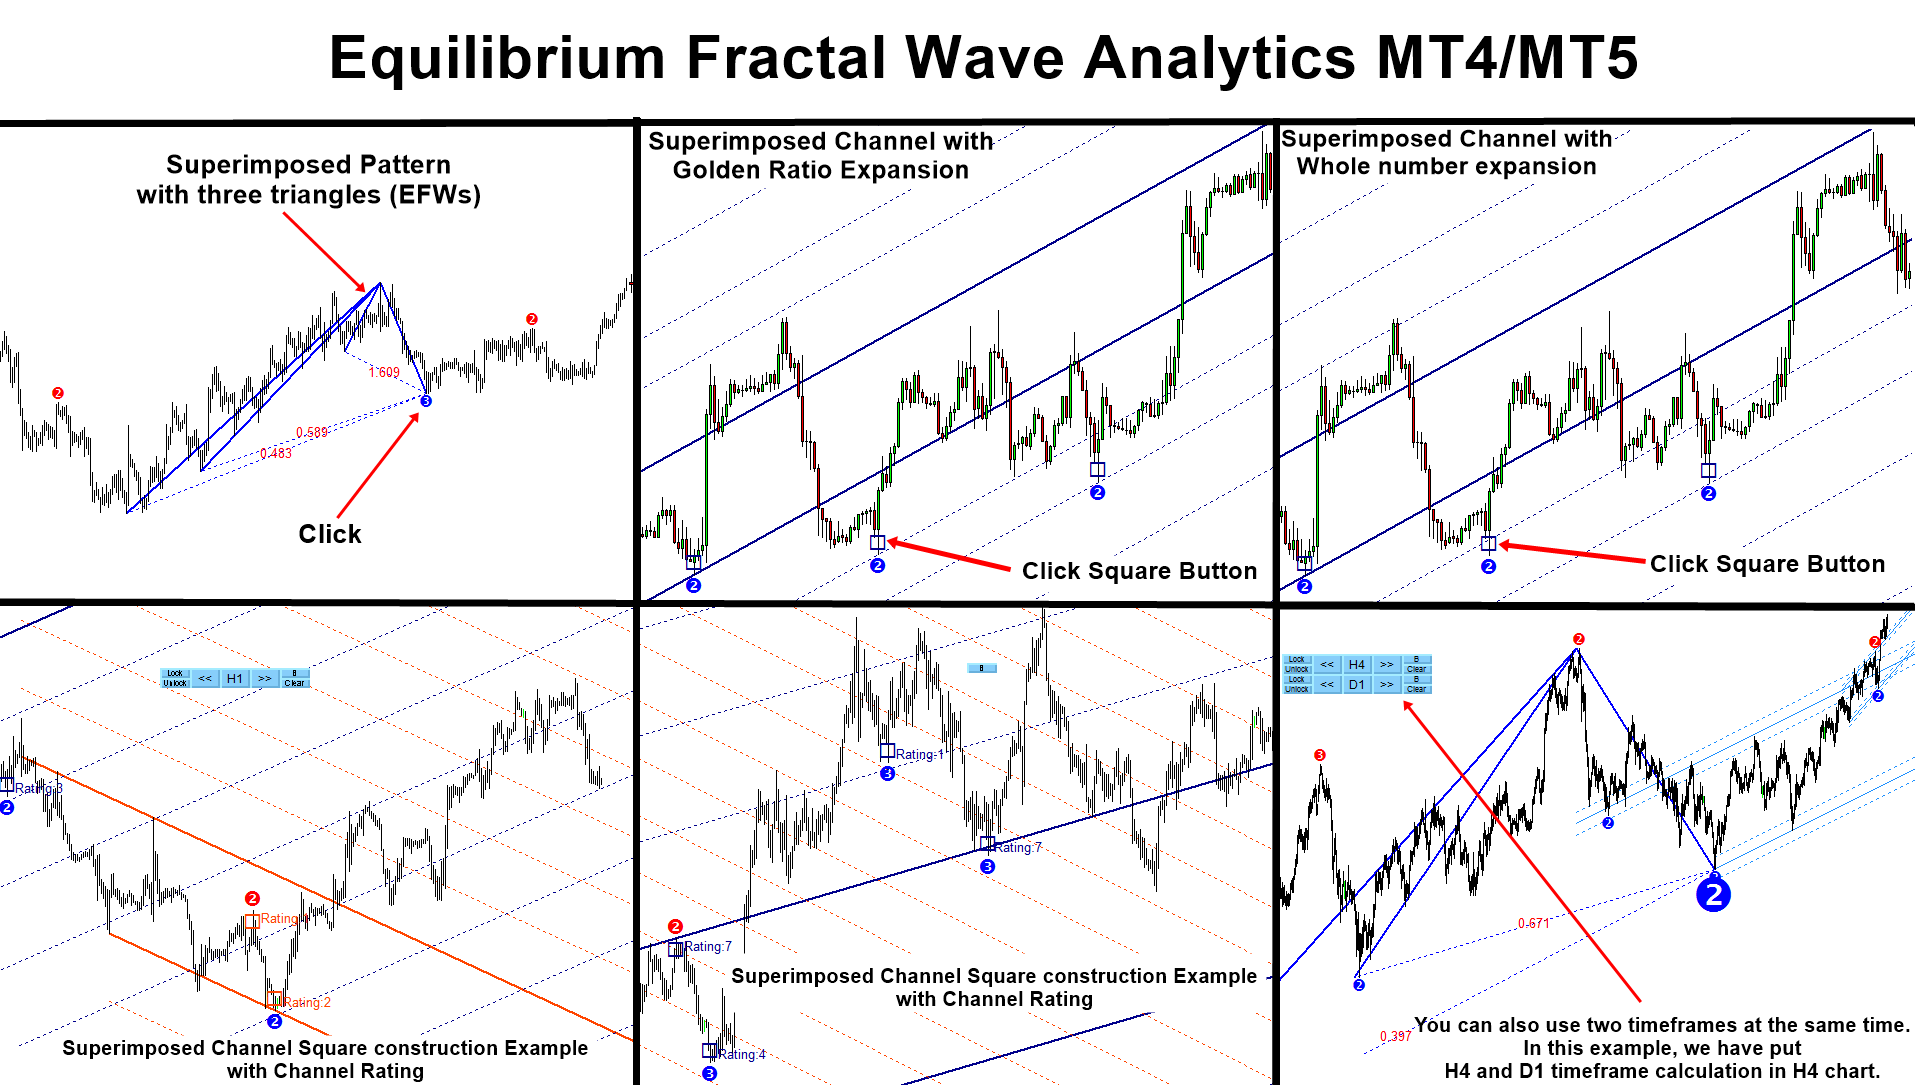
EFW Analytics was designed to accomplish the statement “We trade because there are regularities in the financial market”. EFW Analytics is a set of tools designed to maximize your trading performance by capturing the repeating fractal geometry, known as the fifth regularity in the financial market. The functionality of EFW Analytics consists of three parts including:
1. Equilibrium Fractal Wave Index: exploratory tool to support your trading logic to choose which ratio to trade
2. Superimposed Pattern Detection as turning point analysis
3. Superimposed Channel for market prediction with Golden ratio expansion
4. Superimposed Channel for market prediction with whole number expansion
5. Equilibrium Fractal Wave (EFW) Channel detection
6. Superimposed Channel Rating (Higher rating = higher predictive power)
EFW Analytics provide the graphic rich and fully visual trading styles. In default trading strategy, you will be looking at the combined signal from Superimposed pattern + EFW Channel or Superimposed pattern + Superimposed Channel. In addition, you can perform many more trading strategies in a reversal and breakout mode. You can also run two different timeframes in one chart to enforce your trading decision. Sound alert, email and push notification are built inside the indicator.
Below is the link to the EFW Analytics:
https://algotrading-investment.com/portfolio-item/equilibrium-fractal-wave-analytics/
https://www.mql5.com/en/market/product/27703
https://www.mql5.com/en/market/product/27702

Young Ho Seo
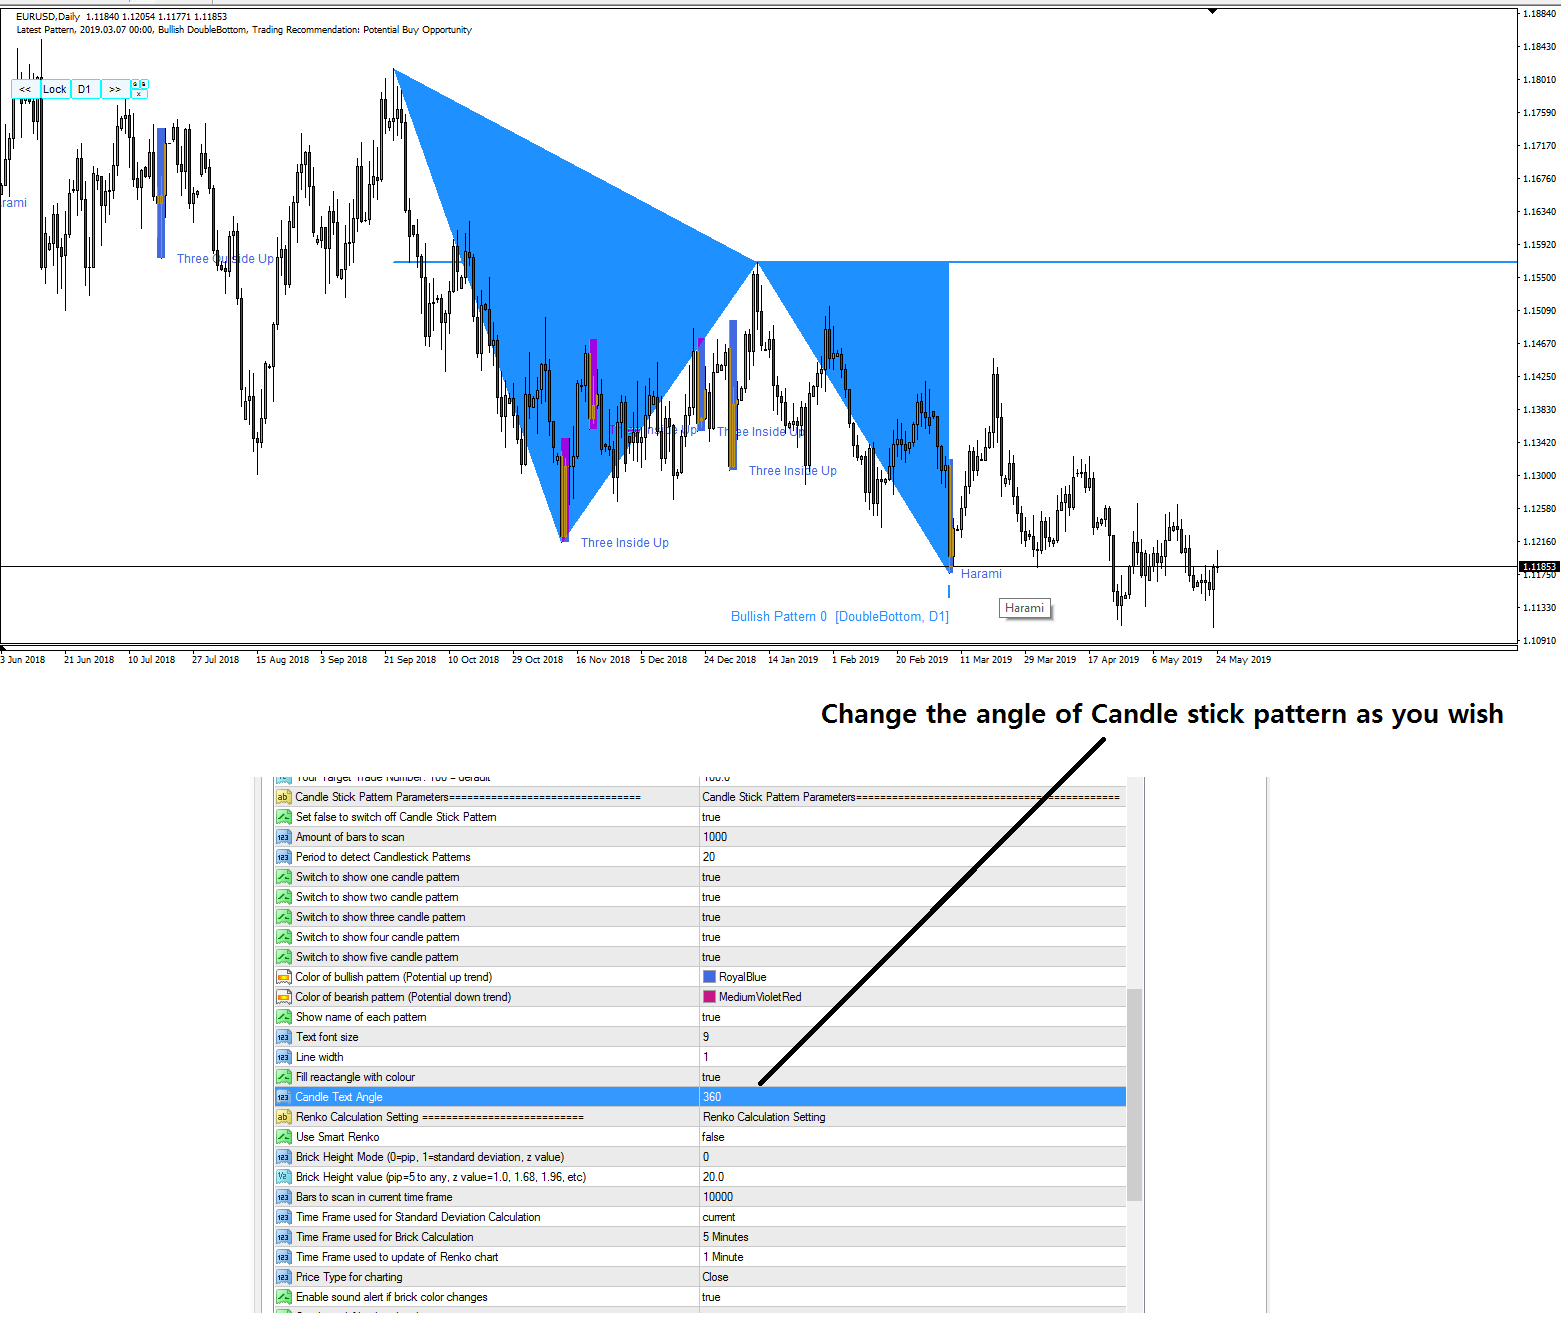
Japanese CandleStick Pattern Control in Price Breakout Pattern Scanner
Japanese candle stick patterns are built in feature inside Price Breakout Pattern Scanner. This is kind of bonus feature for customers who are buying our Price Breakout Pattern Scanner.
In Japanese candlestick inputs, you can switch on and off Candlestick pattern according to their type. For example, there are Japanese candlestick pattern made up from one candle bar, two candle bar, three candle bar, etc. You can switch on and off each according to your preference.
As a default setting, Pattern Name will be printed in chart. At the same time, you can bring your mouse over to each Japanese candlestick pattern to float pattern name in tool tip box (MT5 is more responsive than MT4 for this tool tip box) Alternatively, you can also change the angle of pattern name from horizontal to vertical or vice versa depending on your readability.
Download the latest version for the maximum performance and more profits.
https://www.mql5.com/en/market/product/4859
https://www.mql5.com/en/market/product/4858
https://algotrading-investment.com/portfolio-item/price-breakout-pattern-scanner/

Young Ho Seo
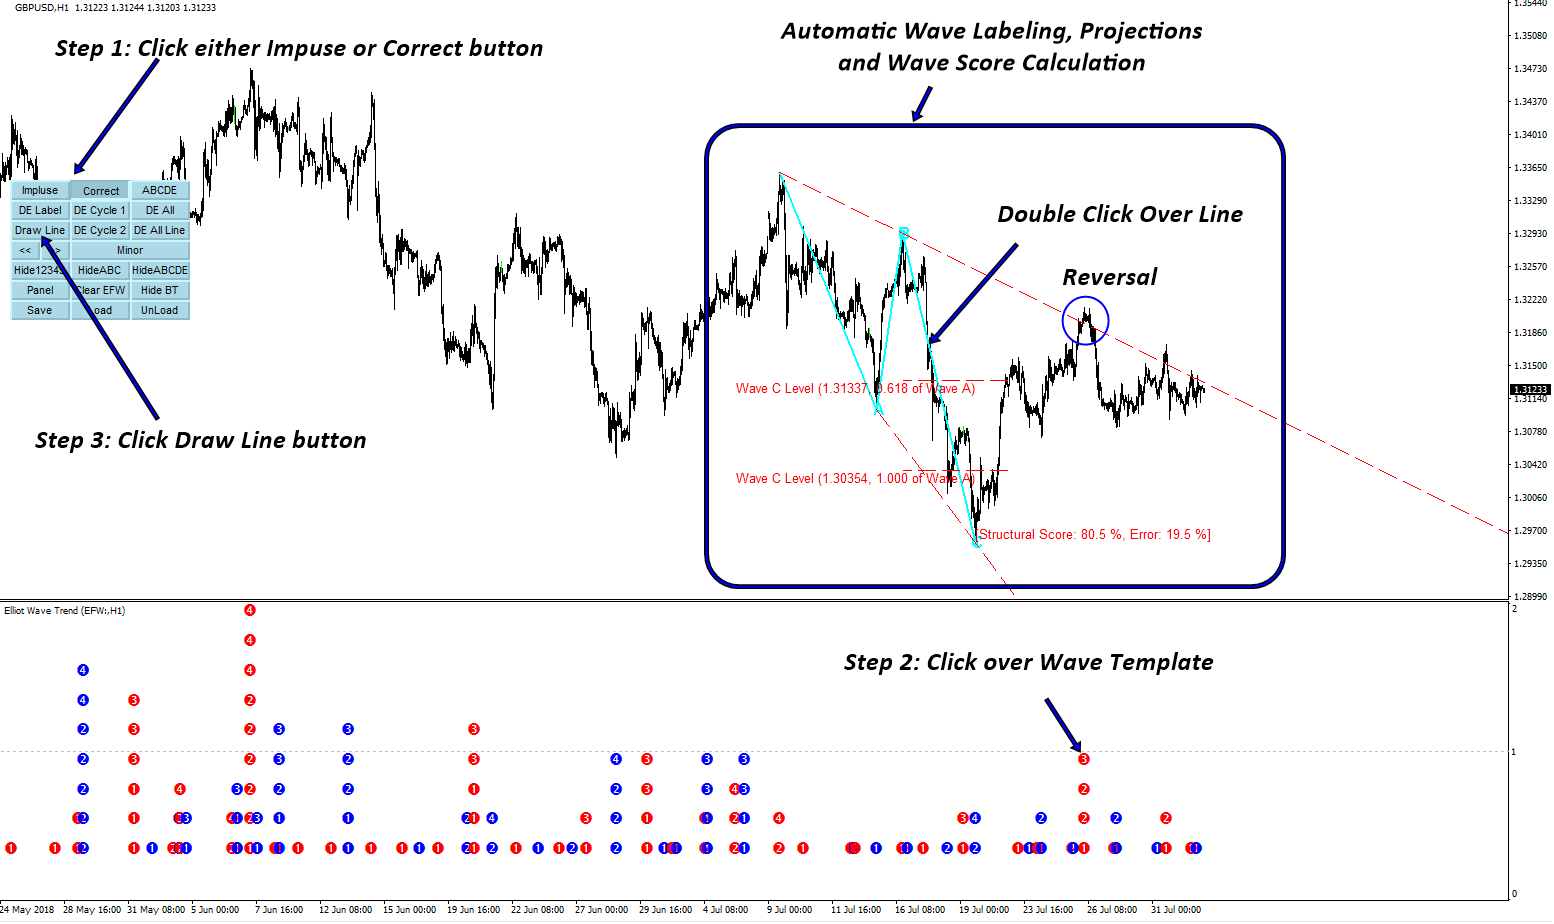
Intro Video For Elliott Wave Trend
Elliott Wave Trend is the most powerful Elliott Wave Trading system, which helps you to trade with various Elliott Wave patterns like Elliott Wave .12345 pattern and Elliott Wave .ABC and Elliott Wave .ABCDE, etc.
Not limited but to give you some feel about the Elliott Wave Trend, you can visit this YouTube Video link:
Here is link for YouTube Video: https://www.youtube.com/watch?v=Oftml-JKyKM
Elliott Wave Trend provide many additional features on top of Elliott Wave Trading. Elliott Wave Trend produces its own support and resistance automatically for your trading. These are not ordinary support and resistance but projecting the location of superimposed wave patterns. You can use this together with your Elliott Wave projection. This will improve your trading performance too.
https://algotrading-investment.com/2019/10/14/support-and-resistance-with-harmonic-pattern-indicator/
There are many other features not described here. But you can find out while you are using Elliott Wave Trend.
Link to Elliott Wave Trend.
https://algotrading-investment.com/portfolio-item/elliott-wave-trend/
https://www.mql5.com/en/market/product/16472
https://www.mql5.com/en/market/product/16479

Young Ho Seo
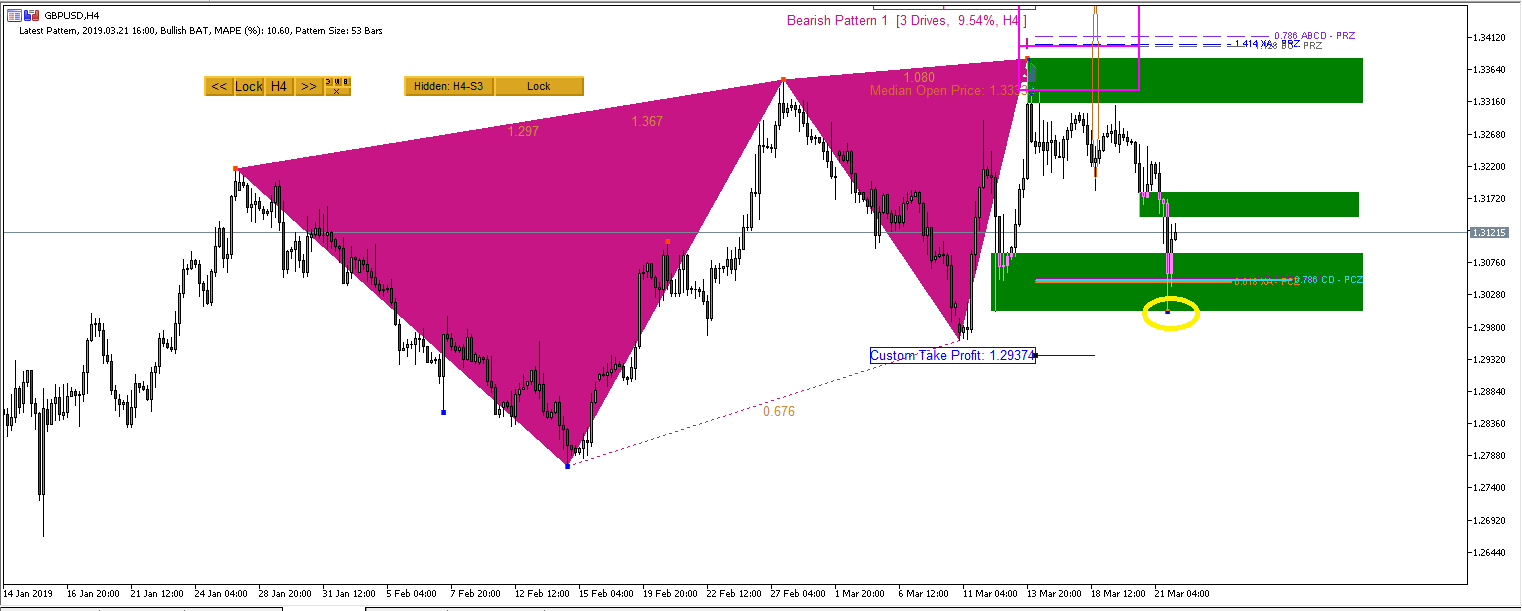
Supply and Demand Zone with Harmonic Pattern Indicator
Supply and Demand Zone are the most important concept for your trading. Supply and Demand zone can be effectively combined with Harmonic Pattern Indicator to improve your trading performance. This is not about the number but about geometry. Your ability to combine these geometry together with Harmonic Pattern Indicator can typically form the secret trading recipes for your successful career. Here is the list of Supply and Demand Zone Indicator that can go together with your harmonic pattern indicator.
Mean Reversion Supply Demand
Classic supply and demand zone indicator. This tools is the great to produce highly accurate supply and demand zone.
https://www.mql5.com/en/market/product/16823
https://www.mql5.com/en/market/product/16851
https://algotrading-investment.com/portfolio-item/mean-reversion-supply-demand/
Ace Supply Demand Zone
This is also great supply and demand zone tool extending the ability of Mean Reversion Supply Demand. What is even better? This is non repainting one. This is the great tool for different level of trader.
https://www.mql5.com/en/market/product/40076
https://www.mql5.com/en/market/product/40075
https://algotrading-investment.com/portfolio-item/ace-supply-demand-zone/

Young Ho Seo
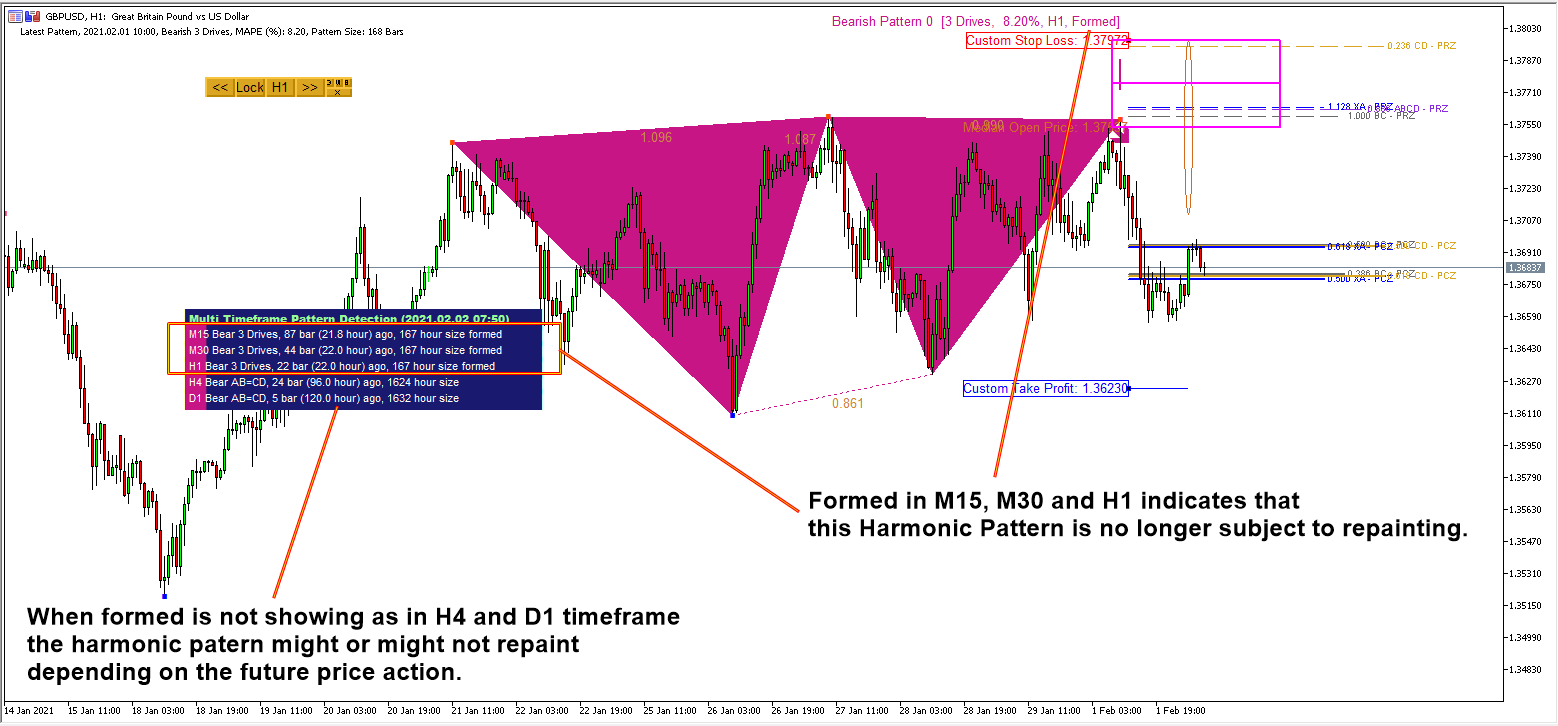
Repainting Harmonic Pattern and Non Repainting Harmonic Pattern
Here is a brief article covering on Repainting Harmonic Pattern and Non Repainting Harmonic Pattern. In Harmonic Pattern Plus and Harmonic Pattern Scenario Planner, they can indicate if the harmonic pattern is completely formed or if the Harmonic Pattern is still in the forming stage. When the pattern is formed completely, the completely formed pattern is no longer subject to the repainting. Forming pattern might repaint or might no repaint depending on the future price action. The attached screenshot will be helpful to confirm your understanding on this.
Depending on your strategy, this piece of information can be important. You can use this piece of information to reinforce your current trading position or exit strategy with Harmonic Pattern. Here is a further thought. If the harmonic pattern is big in terms of its size, then it also takes long time to confirm the pattern formation. In turn, repainting or non repainting confirmation is typically fast with small harmonic pattern. In addition, repainting happens in any technical indicator. But the repainting only affect the last candle bar most of technical indicators. For example, as new price arrives, the moving average indicator will keep changing its value for the last candle bar. As the repainting of ZigZag indicator can affect the last swing point to the previous swing point, ZigZag indicator is affected by repainting over many candle bars from last swing point to previous swing point. Hence, you might feel the repainting more in the ZigZag indicator.
For your information, you do not have to worry about repainting for X3 Chart Pattern Scanner because X3 Chart Pattern Scanner is non repainting and non lagging Harmonic Pattern Scanner. Hence, this article is only applicable to Harmonic Pattern Plus and Harmonic Pattern Scenario Planner. At the same time , you can use X3 Chart Pattern Scanner with Harmonic Pattern Plus in the same chart.
Harmonic Pattern Plus Landing Page
https://www.mql5.com/en/market/product/4488
https://www.mql5.com/en/market/product/4475
https://algotrading-investment.com/portfolio-item/harmonic-pattern-plus/
Harmonic Pattern Scenario Planner Page
https://www.mql5.com/en/market/product/6101
https://www.mql5.com/en/market/product/6240
https://algotrading-investment.com/portfolio-item/harmonic-pattern-scenario-planner/
X3 Chart Pattern Scanner Landing Page
https://www.mql5.com/en/market/product/41993
https://www.mql5.com/en/market/product/41992
https://algotrading-investment.com/portfolio-item/profitable-pattern-scanner/

Young Ho Seo
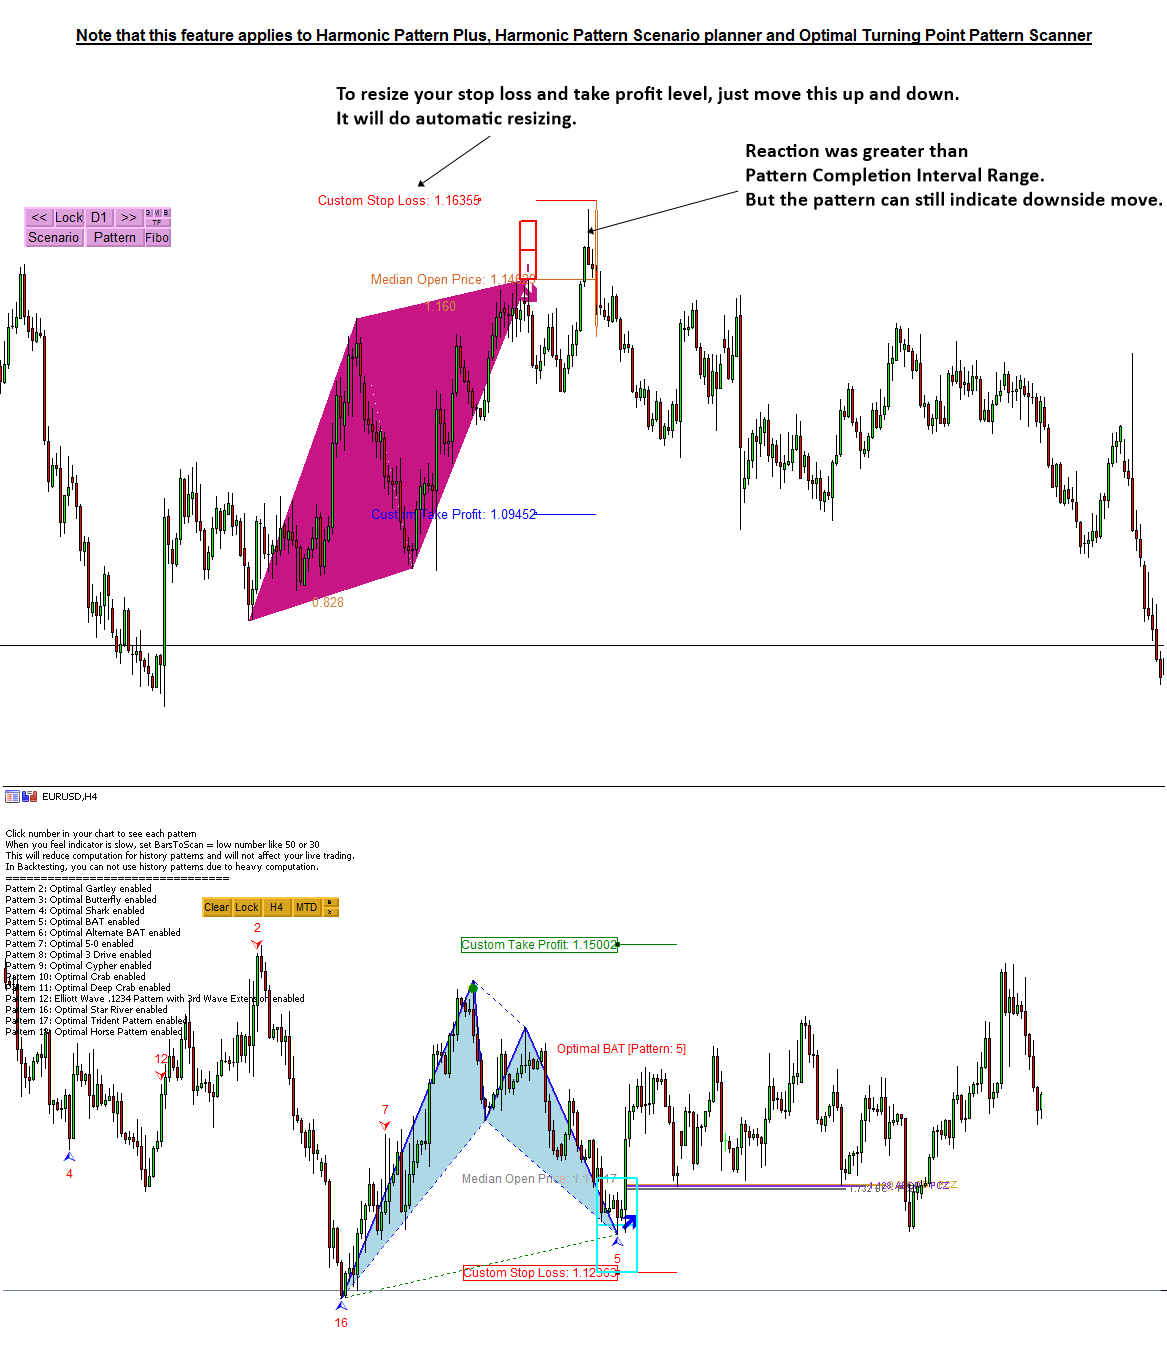
Automatic Resizing your Stop Loss and Take Profit Level with Harmonic Pattern Plus (Harmonic Pattern Scenario Planner)
Having understood all the concept behind the Pattern Completion Interval, you might observe that sometime price can react outside the pattern completion interval. Sure, there is nothing perfect in the world. As long as you understand the pros and cons of using large stop loss size, it is still fine to control your own stop loss size.
However, we still prefer to express stop loss size in terms of pattern completion interval range for convenience. For example, if the original stop loss size was equal to 1 x pattern completion interval, you can certainly use 1.5 x pattern completion interval or 2 x pattern completion interval.
Another consideration before you are using pattern completion interval, if you can enter the market at the competitive price, then you can feel less guilty when you increase your stop loss size because you are still remaining good rewards/Risk ratio. On the other hands, if you have entered market at not so competitive price, then you might be cautious when you increase your stop loss size.
The same feature applies to X3 Chart Pattern Scanner (Non Repainting and Non Lagging Harmonic Pattern and Elliott Wave pattern scanner.)
Harmonic Pattern Plus
https://www.mql5.com/en/market/product/4488
https://www.mql5.com/en/market/product/4475
https://algotrading-investment.com/portfolio-item/harmonic-pattern-plus/
Harmonic Pattern Scenario Planner
https://www.mql5.com/en/market/product/6101
https://www.mql5.com/en/market/product/6240
https://algotrading-investment.com/portfolio-item/harmonic-pattern-scenario-planner/
X3 Chart Pattern Scanner
https://www.mql5.com/en/market/product/41993
https://www.mql5.com/en/market/product/41992
https://algotrading-investment.com/portfolio-item/profitable-pattern-scanner/

Young Ho Seo
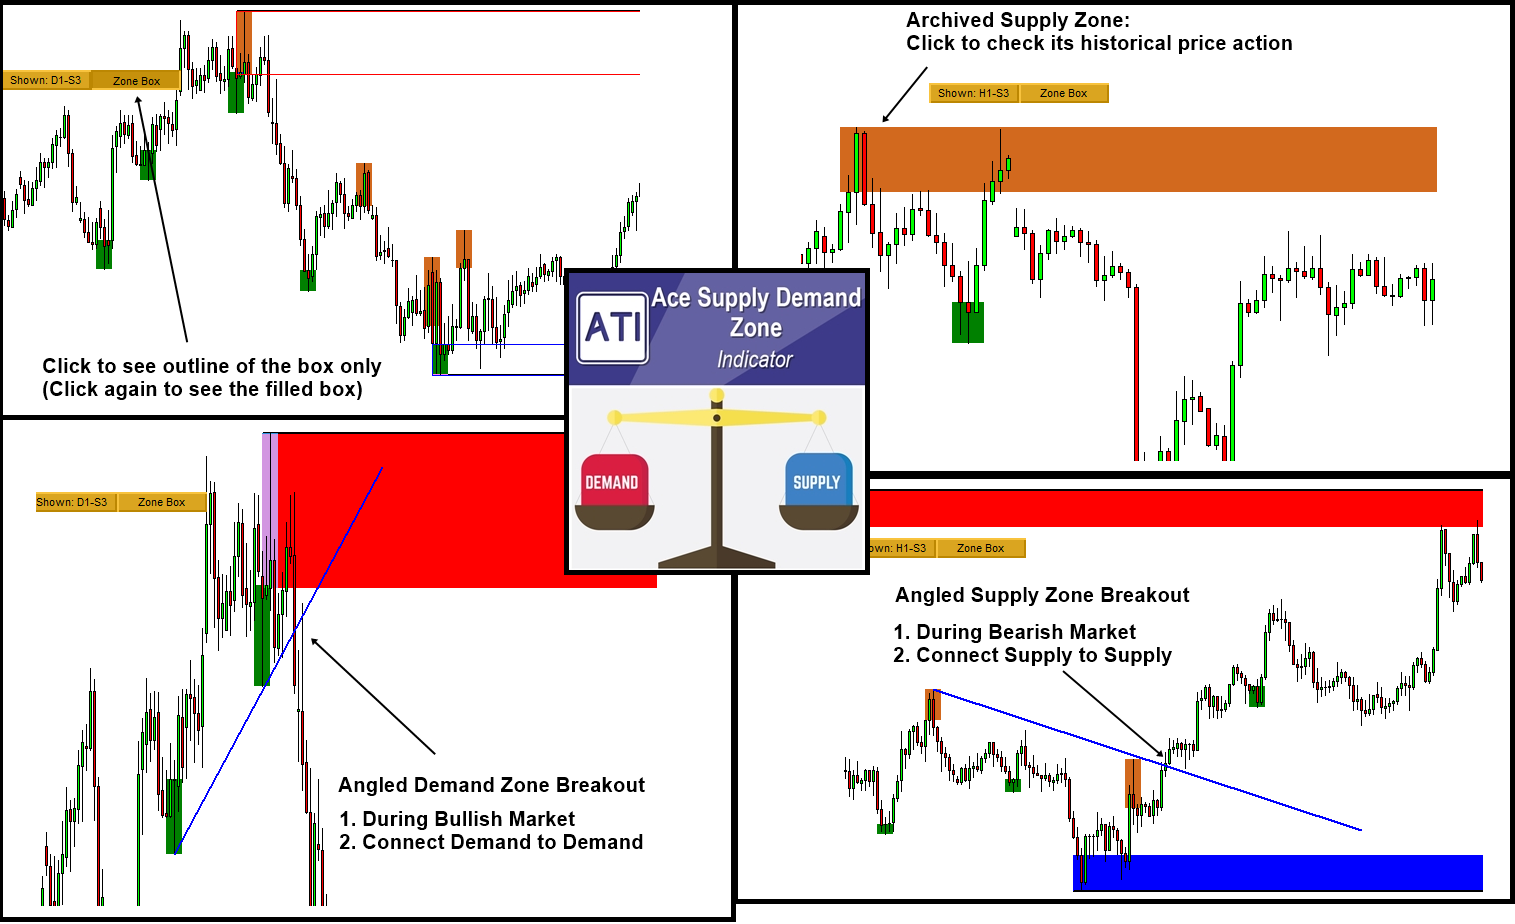
Powerful Non Repainting Supply Demand Zone MetaTrader Indicator
Ace Supply Demand Zone is specially designed non-repainting Supply Demand indicator. Since you have an access to fresh supply and demand zone as well as archived supply demand zone, you can achieve much better profiling on price movement in Forex market.
With the Ability to trade the original supply demand zone trading, you can also perform highly accurate Angled Supply Demand zone trading as a bonus. With a lot of sophisticated gadgets built inside, Ace Supply Demand Zone indicator will provide you unmatched performance against other Supply Demand zone indicator out there.
Here is the link to Ace Supply Demand Zone Indicator.
https://www.mql5.com/en/market/product/40076
https://www.mql5.com/en/market/product/40075
https://algotrading-investment.com/portfolio-item/ace-supply-demand-zone/

Young Ho Seo

New Version of Harmonic Pattern Indicator Released
Here is some hot news about the latest Harmonic Pattern Indicator. In version 11.3, the Harmonic Pattern indicator can indicate if the harmonic pattern is completely formed or it is still in the forming stage. When the pattern is formed completely, the completely formed pattern is no longer subject to the repainting. You can use this piece of information to reinforce your current trading position or exit strategy. Enjoy this new powerful features in our latest Harmonic Pattern Plus and Harmonic Pattern Scenario Planner.
For your information, you do not have to worry about the same things for X3 Chart Pattern Scanner because X3 Chart Pattern Scanner is non repainting and non lagging Harmonic Pattern Scanner. Hence, this update is only applicable to Harmonic Pattern Plus and Harmonic Pattern Scenario Planner. At the same time , you can use X3 Chart Pattern Scanner with Harmonic Pattern Plus in the same chart.
.
Harmonic Pattern Plus Landing Page
https://www.mql5.com/en/market/product/4488
https://www.mql5.com/en/market/product/4475
https://algotrading-investment.com/portfolio-item/harmonic-pattern-plus/
.
Harmonic Pattern Scenario Planner Page
https://www.mql5.com/en/market/product/6101
https://www.mql5.com/en/market/product/6240
https://algotrading-investment.com/portfolio-item/harmonic-pattern-scenario-planner/
.
X3 Chart Pattern Scanner Landing Page
https://www.mql5.com/en/market/product/41993
https://www.mql5.com/en/market/product/41992
https://algotrading-investment.com/portfolio-item/profitable-pattern-scanner/

Young Ho Seo

Most advanced Elliott Wave Software for your Trading
Elliott Wave Trend is the most advanced Elliott Wave Trading software, which helps you to trade with various Elliott Wave patterns like Wave .12345 pattern and Wave .ABC and Wave .ABCDE, etc. Elliott Wave Trend was built on the concept of Precision Trading with Elliott Wave Structure Score. Our Elliott Wave Trend is professional tool for professional trader. Yet, the price of it is affordable.
With Elliott Wave Trend, you can also share your analysis with your Friend and clients through Elliott Wave Reader.
Our Elliott Wave Trend is available in both MetaTrader 4 and MetaTrader 5 version.
https://algotrading-investment.com/2018/10/25/how-elliott-wave-can-improve-your-trading-performance/
Link to Elliott Wave Trend.
https://algotrading-investment.com/portfolio-item/elliott-wave-trend/
https://www.mql5.com/en/market/product/16472
https://www.mql5.com/en/market/product/16479

Young Ho Seo
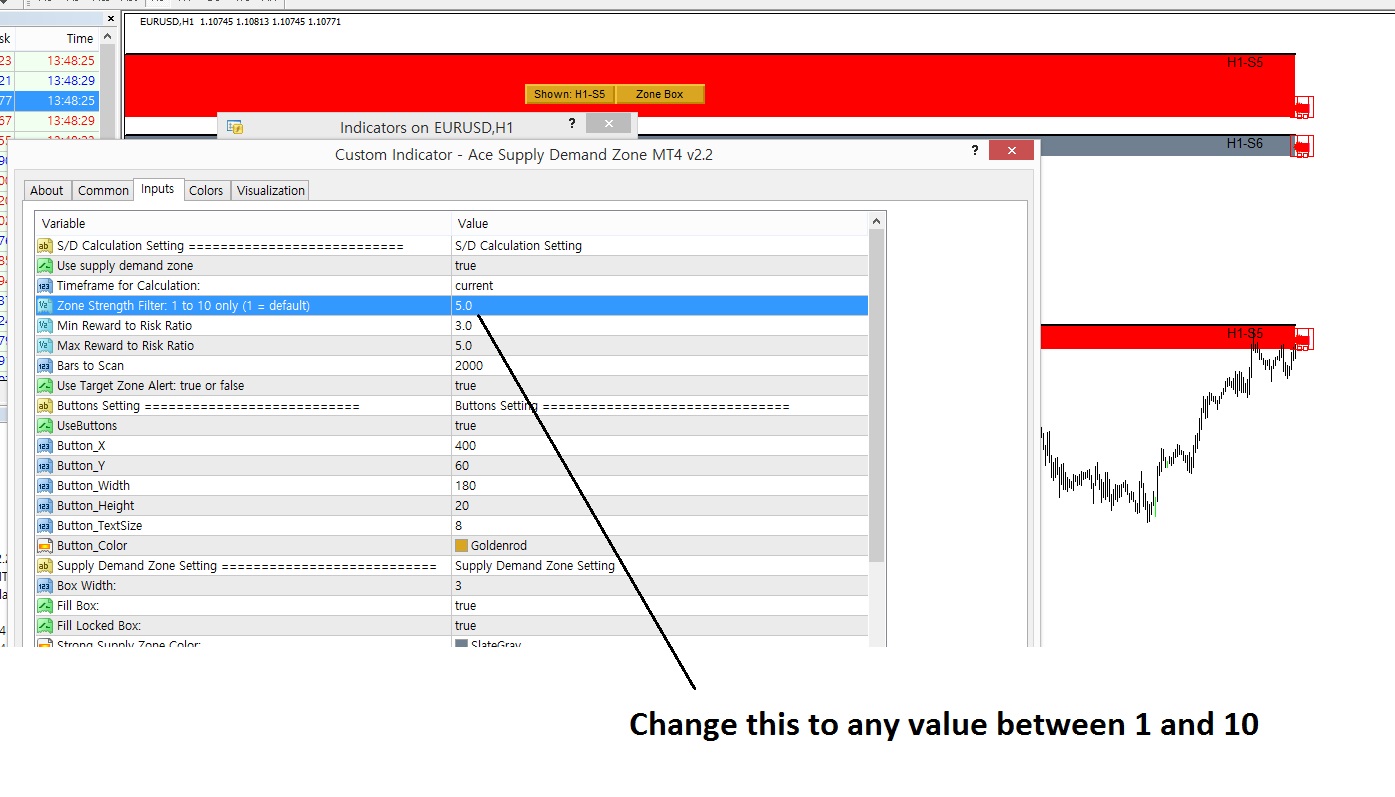
Choosing Strength at Origin in your Supply Demand Zone indicator
Ace Supply Demand Zone indicator is non repainting Supply Demand zone indicator. You can consider it as the advanced support and resistance indicator too. Strength at Origin input is an important input for supply and demand zone. This input can be selected between 1 and 10. Strength at Origin 1 is less significant and 10 is more significant in relative term. But this is only rough guide line about Strength at Origin input for supply and demand zone trading. We also provide the screenshot of how to do it in your chart. We hope this article is useful.
Below is link to Ace Supply Demand Zone Indicator.
https://www.mql5.com/en/market/product/40076
https://www.mql5.com/en/market/product/40075
https://algotrading-investment.com/portfolio-item/ace-supply-demand-zone/

Young Ho Seo
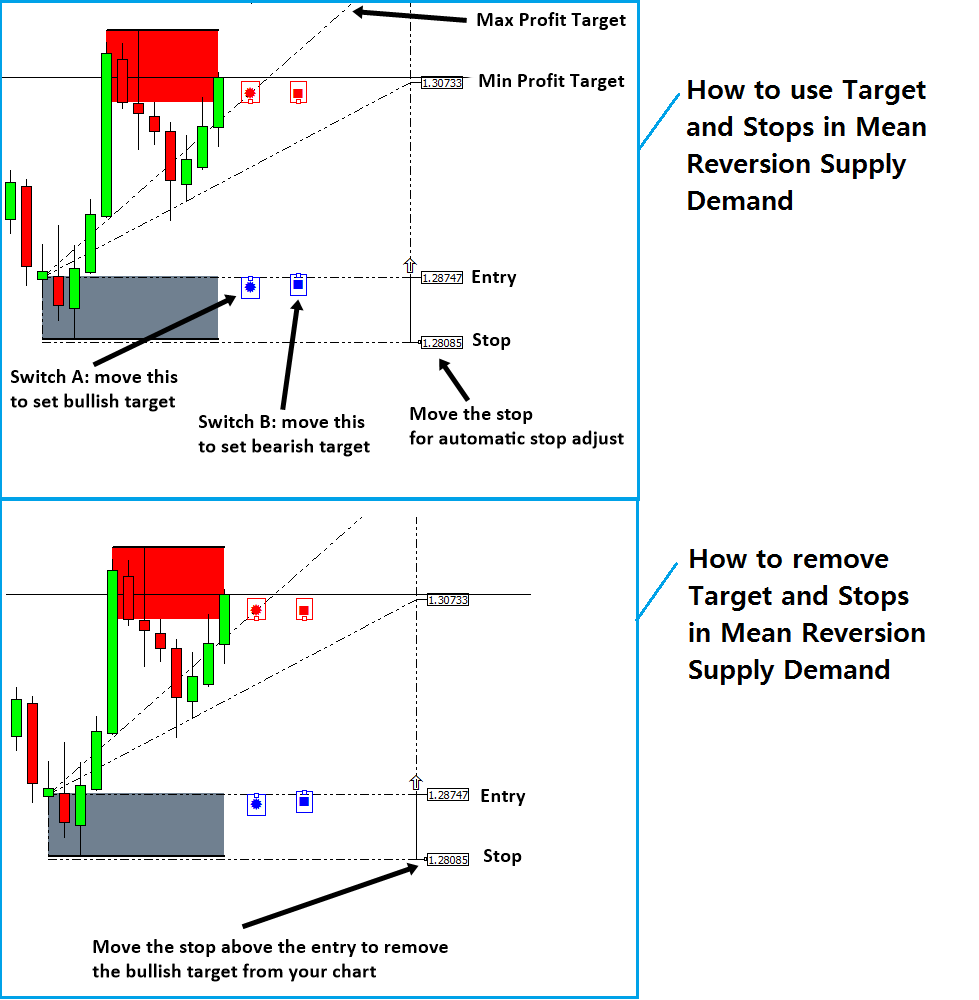
Mean Reversion Supply Demand – How to Remove Take Profit and Stop Loss Levels
One of the greatest advantage of Mean Reversion Supply Demand is that it provide a flexible Profit and stop target for your trading. After you have learnt how to use this profit targets, now you want to learn how to remove them. Of course, there is a way to remove them. The trick is simply moving the stop text above the Entry text (for the case of buy). You will do the opposite for the case of sell. In the screenshot, the bottom image describe how to remove the targets from your chart.
There is another approach to remove take profit and stop loss targets. We provide the shortcut in keyboard for doing the same task. Simply hit “z” button in your keyboard. This will also remove the stop loss and take profit targets if you do not need them any longer.
https://www.mql5.com/en/market/product/16823
https://www.mql5.com/en/market/product/16851
https://algotrading-investment.com/portfolio-item/mean-reversion-supply-demand/

Young Ho Seo
Mean Reversion Supply Demand – How to Remove Take Profit and Stop Loss Levels
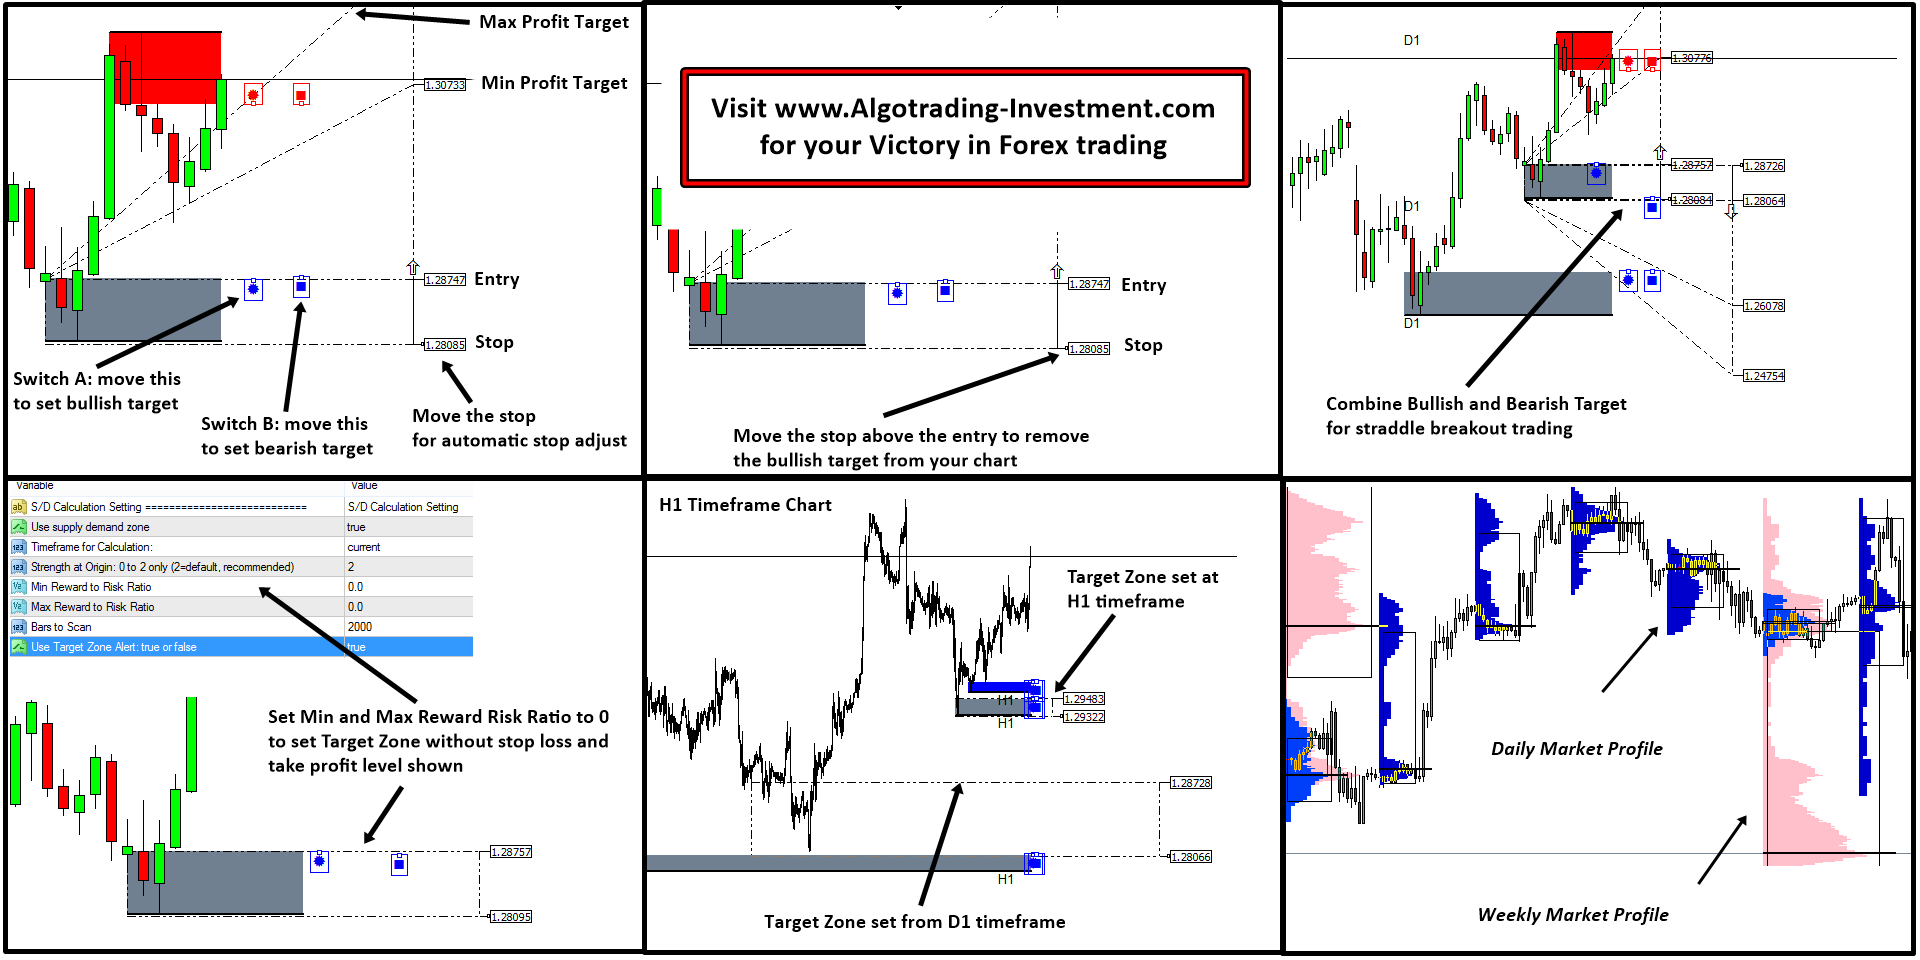
One of the greatest advantage of Mean Reversion Supply Demand is that it provide a flexible Profit and stop target for your trading. After you have learnt how to use this profit targets, now you want to learn how to remove them. Of course, there is a way to remove them. The trick is simply moving the stop text above the Entry text (for the case of buy). You will do the opposite for the case of sell. In the screenshot, the bottom image describe how to remove the targets from your chart.
There is another approach to remove take profit and stop loss targets. We provide the shortcut in keyboard for doing the same task. Simply hit “z” button in your keyboard. This will also remove the stop loss and take profit targets if you do not need them any longer.
https://www.mql5.com/en/market/product/16823
https://www.mql5.com/en/market/product/16851
https://algotrading-investment.com/portfolio-item/mean-reversion-supply-demand/
One of the greatest advantage of Mean Reversion Supply Demand is that it provide a flexible Profit and stop target for your trading. After you have learnt how to use this profit targets, now you want to learn how to remove them. Of course, there is a way to remove them. The trick is simply moving the stop text above the Entry text (for the case of buy). You will do the opposite for the case of sell. In the screenshot, the bottom image describe how to remove the targets from your chart.
There is another approach to remove take profit and stop loss targets. We provide the shortcut in keyboard for doing the same task. Simply hit “z” button in your keyboard. This will also remove the stop loss and take profit targets if you do not need them any longer.
https://www.mql5.com/en/market/product/16823
https://www.mql5.com/en/market/product/16851
https://algotrading-investment.com/portfolio-item/mean-reversion-supply-demand/

Young Ho Seo
Supply Demand Zone Indicator on MetaTrader 4
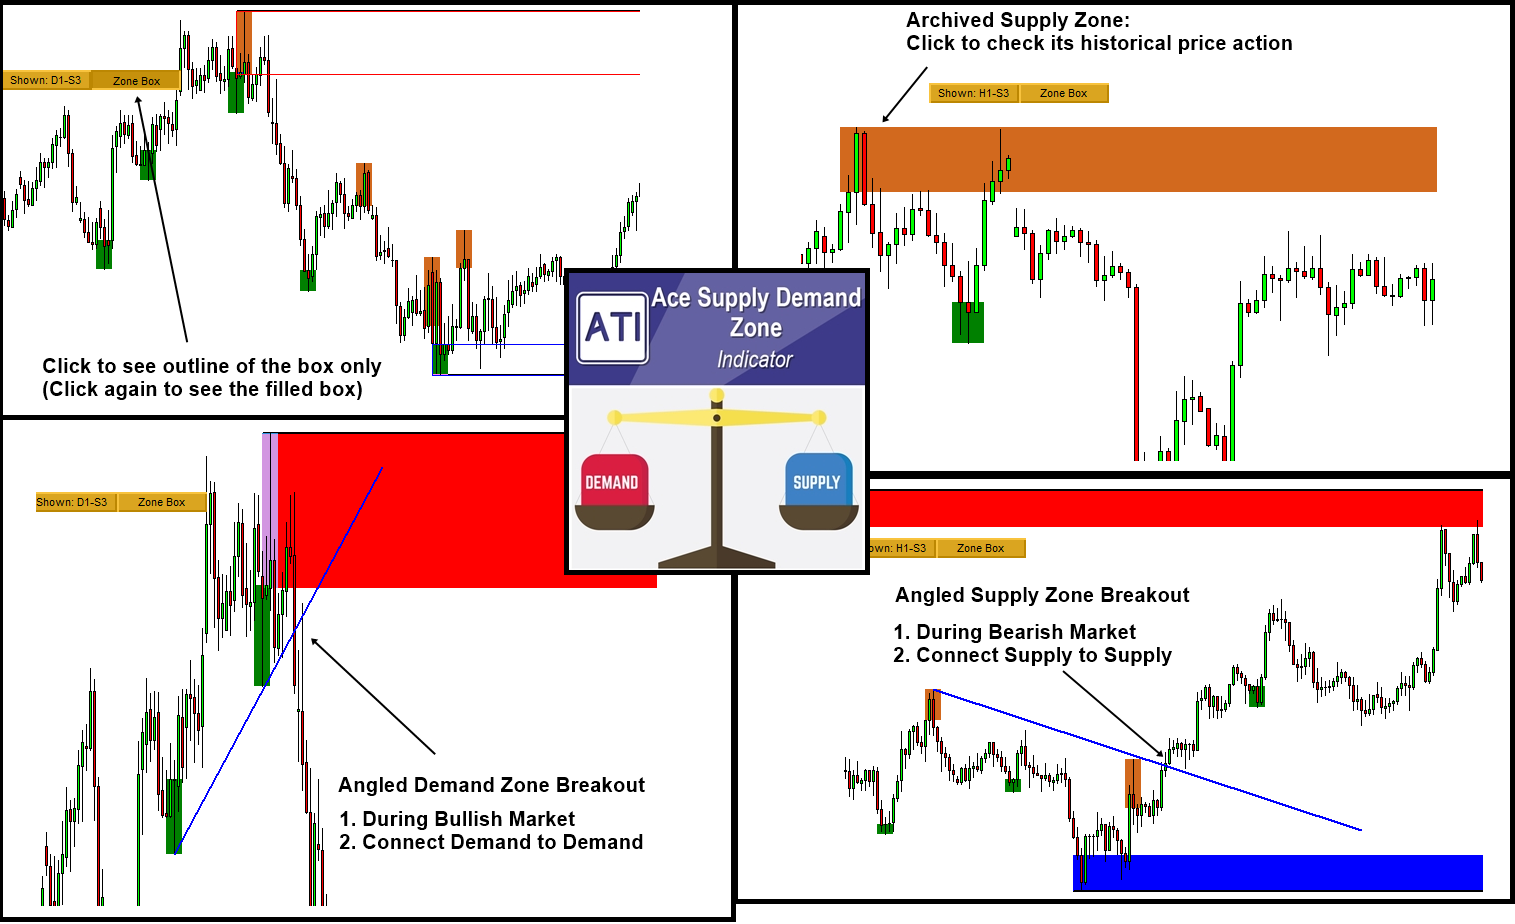
MetaTrader 4 is one of the most popular trading platform since 2010. It is accessible for free of charge for any trader from all over the world. We provide a range of powerful supply demand zone indicator particularly designed for MetaTrader 4 platform.
Here is the list of Advanced Supply Demand Zone Indicator. These supply and demand zone indicators are rich in features with many powerful features to help you to trade the right supply and demand zone to trading.
Mean Reversion Supply Demand on MetaTrader 4
Mean Reversion Supply Demand indicator is our earliest supply demand zone indicator and loved by many trader all over the world. It is great to trade with reversal and breakout. You can also fully setup your trading with stop loss and take profit target. Please note that Mean Reversion Supply Demand is the excellent tool but it is repainting supply demand zone indicator.
Below are the links to MetaTrader 4 version of the Mean Reversion Supply Demand indicator.
https://www.mql5.com/en/market/product/16851
https://algotrading-investment.com/portfolio-item/mean-reversion-supply-demand
Ace Supply Demand Zone Indicator on MetaTrader 4
Ace Supply Demand Zone indicator is our next generation supply demand zone indicator. It was built in non repainting and non lagging algorithm. On top of many powerful features, you can also make use of archived supply and demand zone in your trading to find more accurate trading opportunity. Ace Supply Demand Zone indicator is the non repainting supply demand zone indicator. If you prefer the non repainting indicator, then you must use Ace Supply Demand Zone Indicator.
Below are the links to MetaTrader 4 version of the Ace Supply Demand Zone indicator.
https://www.mql5.com/en/market/product/40076
https://algotrading-investment.com/portfolio-item/ace-supply-demand-zone
For your information, both indicators provides many powerful features to complete for your trading. You can also use this indicators together with harmonic pattern and elliott wave pattern indicators.

Young Ho Seo
How to Change Renko Brick Size in Smart Renko
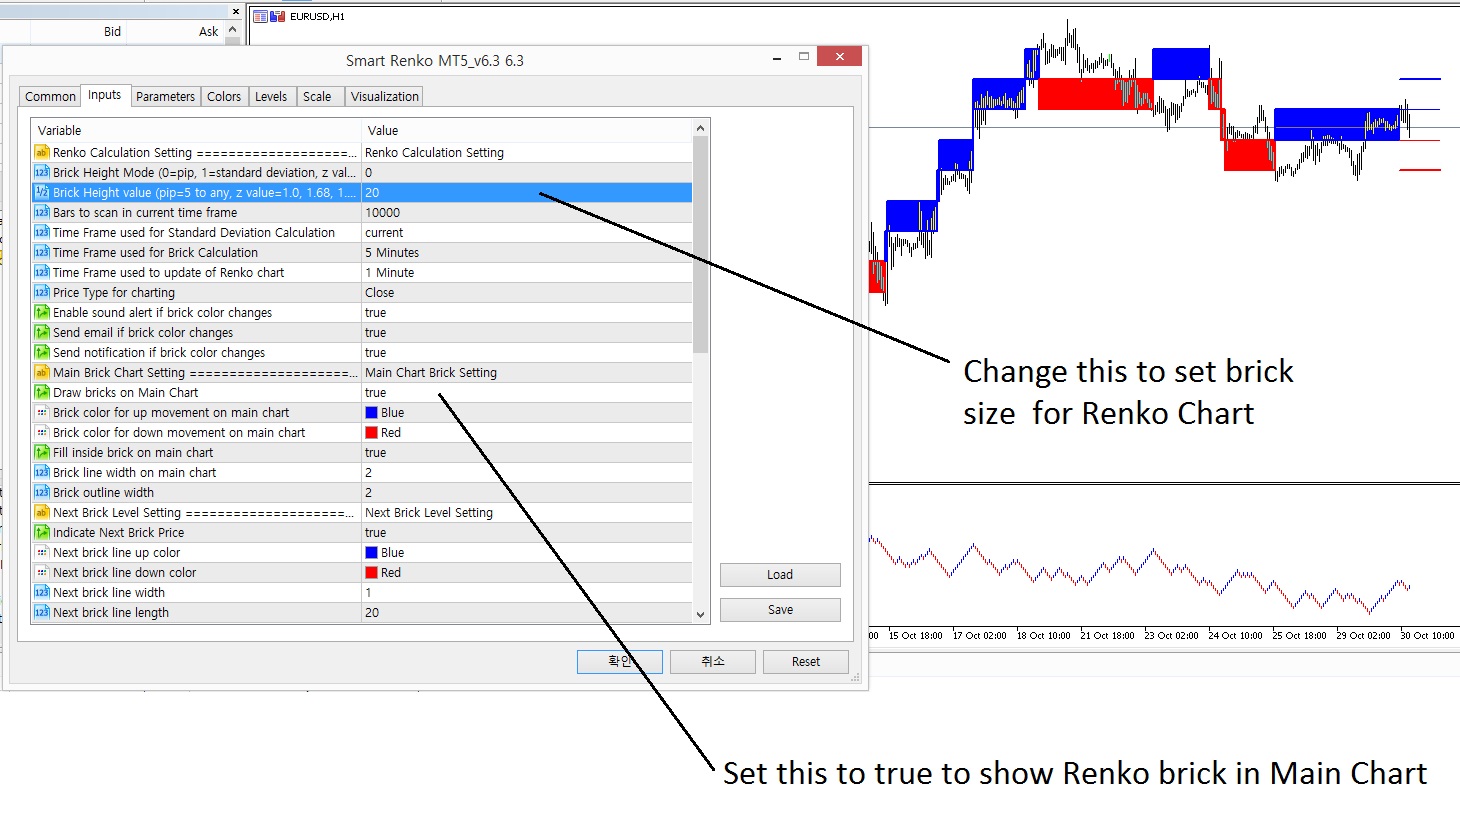
In Renko Chart, Renko brick size is the most important control variable in your trading. You have a choice of brick size. However, it is typically recommended to use multiple of 10 or 5 as the choice. For example, you can use following brick size depending on the size of price range in your chart.
Recommended brick size: 20 pips, 25 pips, 50 pips, 100 pips, 200 pips, 2000 pips, 20000 pips, etc.
If you have a math background and if you do understand standard deviation, it is good to guess these numbers around 1 standard deviation. This is just some idea for your trading.
For some futures, commodities, Stock price, you need to have 1 or 2 more zeros in your brick size in comparison to Forex market. Just do some experiment to find the suitable and sensible brick size for your trading.
This Renko tools are available in both Smart Renko and Price Breakout Pattern Scanner. Hence this article applies to Smart Renko and Price Breakout Pattern Scanner.
For MetaTrader 4 users, to calculate bricks, you have to download historical data before using our Smart Renko chart.
* Below is link to Smart Renko
https://www.mql5.com/en/market/product/9911
https://www.mql5.com/en/market/product/9944
https://algotrading-investment.com/portfolio-item/smart-renko/
* Below is link to Price Breakout Pattern Scanner
https://www.mql5.com/en/market/product/4859
https://www.mql5.com/en/market/product/4858
https://algotrading-investment.com/portfolio-item/price-breakout-pattern-scanner/

Young Ho Seo
Excessive Momentum Indicator and Trading Operation
Excessive Momentum Indicator automatically detects the broken balance between supply and demand of investors in the financial market. Detection of this broken balance provides the great market timing for the entry and exit for our trading. In this short article, we explain some of the controllable inputs in the Excessive Momentum Indicator.
There are the four main inputs, controlling the calculation. They are:
* Bars To Scan: amount of candle bars to calculate the indicator. Choose bigger numbers if you want to see the calculation over longer historical period.
* Momentum Strength Factor: Momentum Strength is the strength of Excessive Momentum to detect. It can stay between 0.1 and 0.5. In theory, it can go up to 1.0. However, you will not get many signals to trade. The default setting is 0.1. You can try various Momentum Strength Factor to optimize your trading performance if you wish.
* Equilibrium Fractal Wave Scale: This input controls the size of Fractal Wave when we detect the excessive momentum. If you put bigger number, then you get less signals to trade. The default setting is 0.5.
* Detrending Period: This input controls the statistical calculation in the algorithm. It should stay between 20 and 50.
Above four inputs are important because they can affect the number and quality of trading signals. You can use the default setting most of time. However, it is also possible that you can try different inputs and check how they perform in the historical data. Rest of inputs are probably self-explanatory from their name.
Now, let us cover the trading signals. In the Excessive Momentum indicator, you get two signal alerts. Firstly, you will get alert when the Excessive Momentum is starting in the market. In this case, it will notify you the starting price. At this stage, the excessive momentum is not completely expanded yet.
Secondly, you will get alert when the Excessive Momentum is completed in the market. At this stage, you will be notified both starting price and ending price of Excessive Momentum.
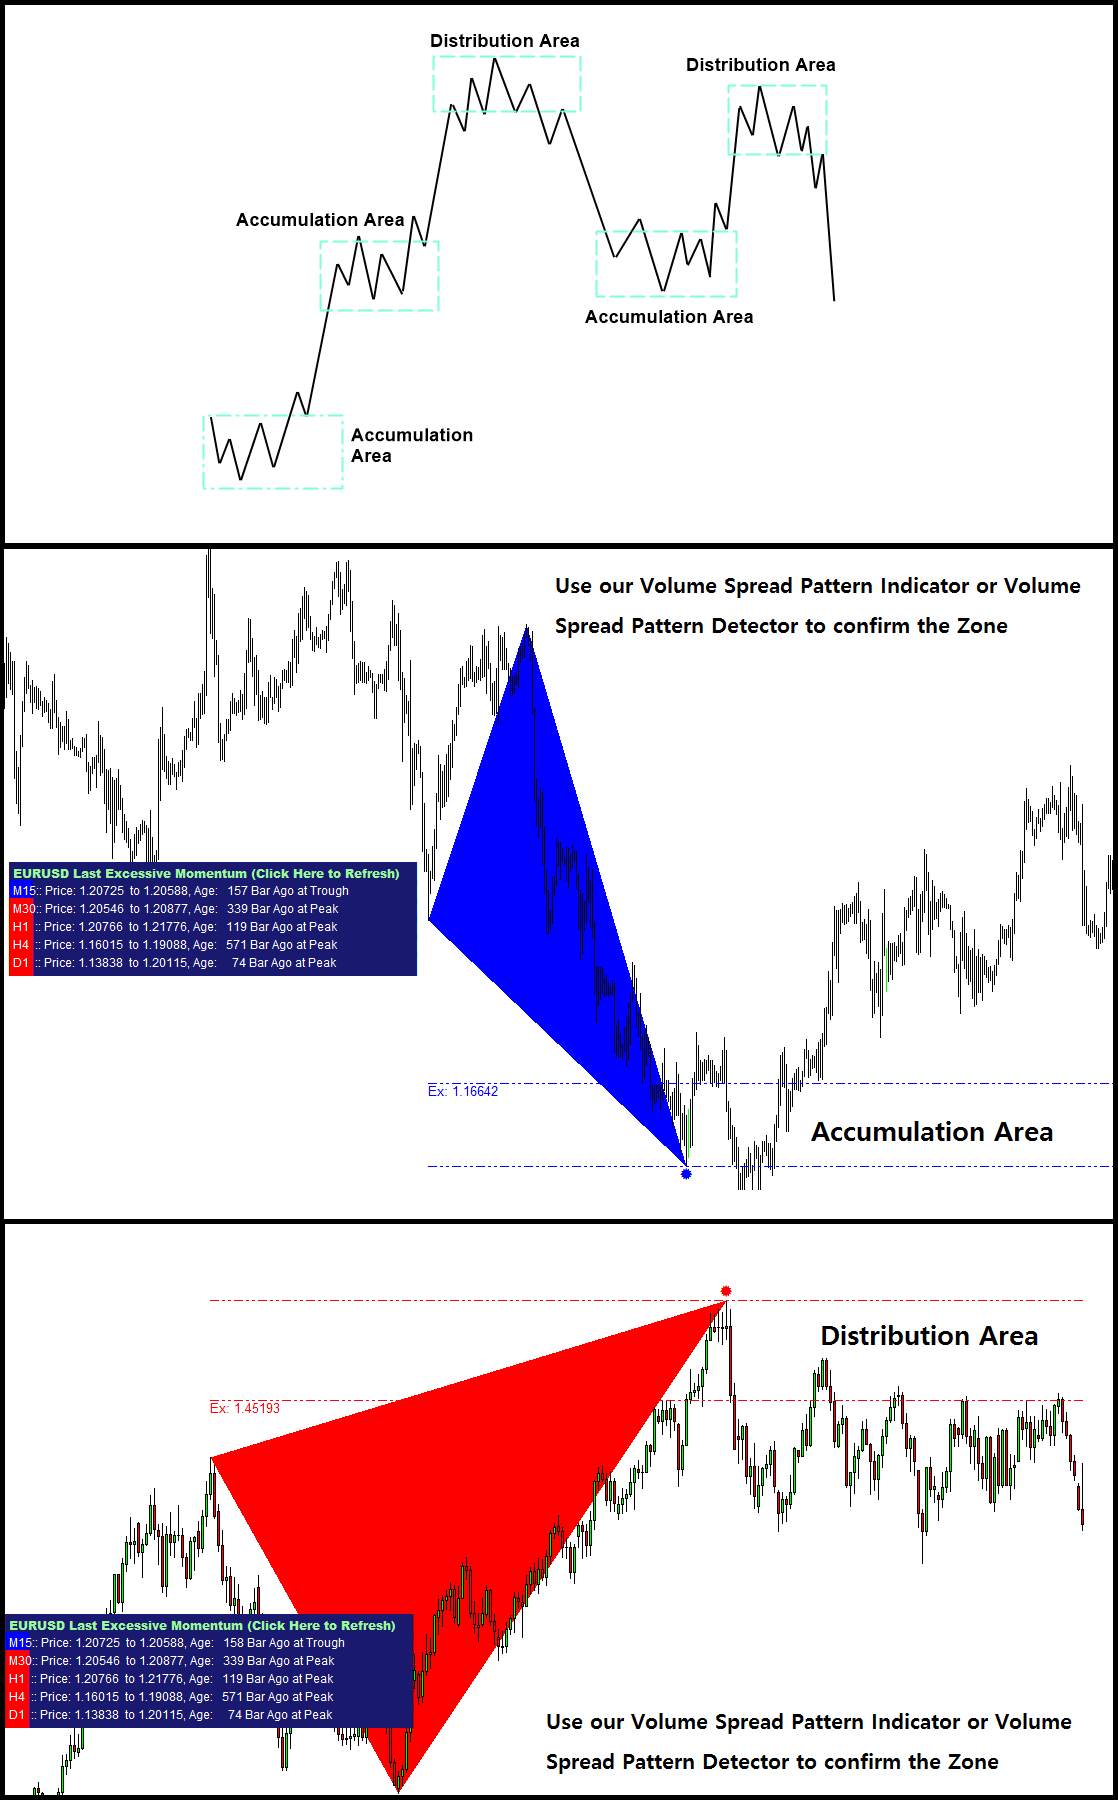
Both starting price and ending price of Excessive Momentum form the Excessive Momentum Zone. At which signal you want to trade is up to your choice. You can use the zone as the breakout trading when the zone is narrow. When the zone is sufficiently large, it might be possible to aim some reversal trading opportunity too.
At the same time, this Excessive Momentum Zone can be considered as either Accumulation or Distribution area in the Volume Spread Analysis. You can further find the symptoms of accumulation and distribution area using our Volume Spread Pattern Indicator (Paid and Advanced version) or Volume Spread Pattern Detector (Free and Light version).
Below is the landing page for Excessive Momentum Indicator.
https://algotrading-investment.com/portfolio-item/excessive-momentum-indicator/
https://www.mql5.com/en/market/product/30641
https://www.mql5.com/en/market/product/30621
Here is the link to Volume Spread Pattern Indicator (Paid and Advanced Version).
https://www.mql5.com/en/market/product/32961
https://www.mql5.com/en/market/product/32960
https://algotrading-investment.com/portfolio-item/volume-spread-pattern-indicator/
Here is the link to Volume Spread Pattern Detector (Free and Light Version).
https://www.mql5.com/en/market/product/28438
https://www.mql5.com/en/market/product/28439
https://algotrading-investment.com/portfolio-item/volume-spread-pattern-detector/

Young Ho Seo
Powerful Non Repainting Supply Demand Zone MetaTrader Indicator
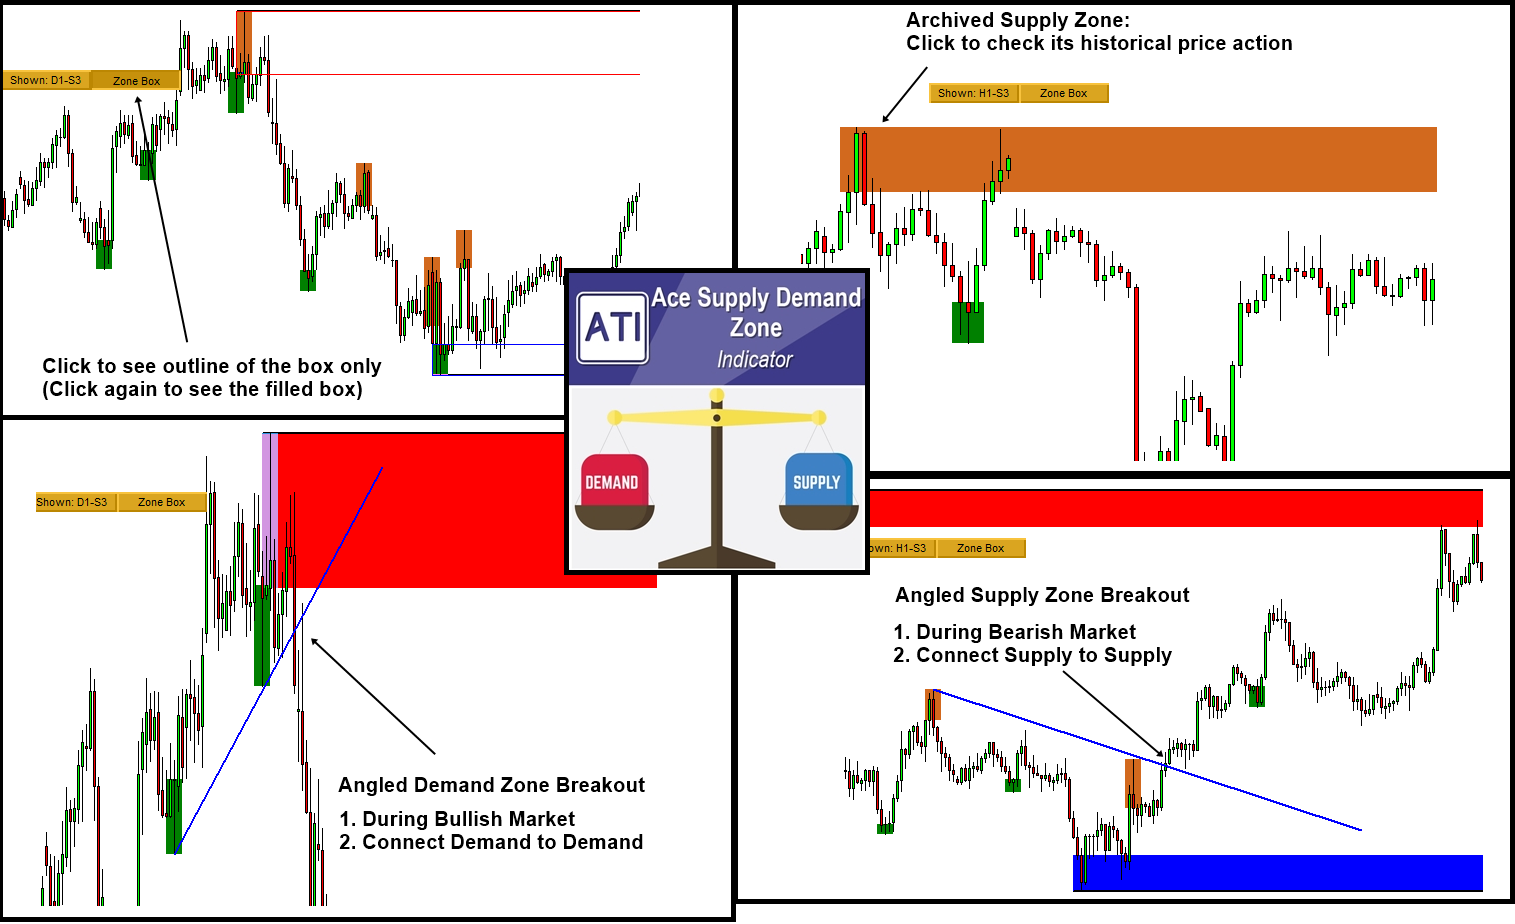
Ace Supply Demand Zone is specially designed non-repainting Supply Demand indicator. Since you have an access to fresh supply and demand zone as well as archived supply demand zone, you can achieve much better profiling on price movement in Forex market.
With the Ability to trade the original supply demand zone trading, you can also perform highly accurate Angled Supply Demand zone trading as a bonus. With a lot of sophisticated gadgets built inside, Ace Supply Demand Zone indicator will provide you unmatched performance against other Supply Demand zone indicator out there.
Here is the link to Ace Supply Demand Zone Indicator.
https://www.mql5.com/en/market/product/40076
https://www.mql5.com/en/market/product/40075
https://algotrading-investment.com/portfolio-item/ace-supply-demand-zone/
Ace Supply Demand Zone is specially designed non-repainting Supply Demand indicator. Since you have an access to fresh supply and demand zone as well as archived supply demand zone, you can achieve much better profiling on price movement in Forex market.
With the Ability to trade the original supply demand zone trading, you can also perform highly accurate Angled Supply Demand zone trading as a bonus. With a lot of sophisticated gadgets built inside, Ace Supply Demand Zone indicator will provide you unmatched performance against other Supply Demand zone indicator out there.
Here is the link to Ace Supply Demand Zone Indicator.
https://www.mql5.com/en/market/product/40076
https://www.mql5.com/en/market/product/40075
https://algotrading-investment.com/portfolio-item/ace-supply-demand-zone/

Young Ho Seo
Choosing Strength at Origin in your Supply Demand Zone indicator
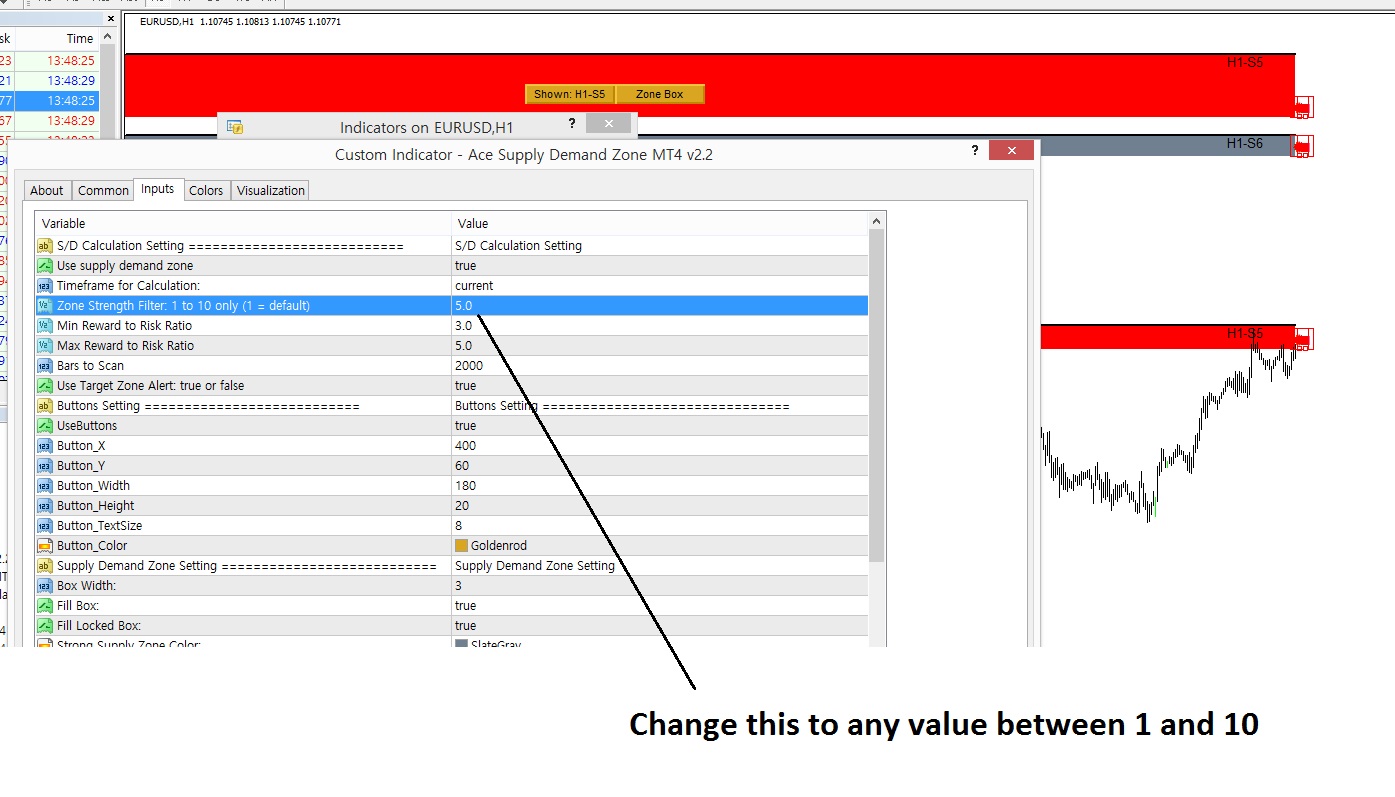
Ace Supply Demand Zone indicator is non repainting Supply Demand zone indicator. You can consider it as the advanced support and resistance indicator too. Strength at Origin input is an important input for supply and demand zone. This input can be selected between 1 and 10. Strength at Origin 1 is less significant and 10 is more significant in relative term. But this is only rough guide line about Strength at Origin input for supply and demand zone trading. We also provide the screenshot of how to do it in your chart. We hope this article is useful.
Below is link to Ace Supply Demand Zone Indicator.
https://www.mql5.com/en/market/product/40076
https://www.mql5.com/en/market/product/40075
https://algotrading-investment.com/portfolio-item/ace-supply-demand-zone/
Ace Supply Demand Zone indicator is non repainting Supply Demand zone indicator. You can consider it as the advanced support and resistance indicator too. Strength at Origin input is an important input for supply and demand zone. This input can be selected between 1 and 10. Strength at Origin 1 is less significant and 10 is more significant in relative term. But this is only rough guide line about Strength at Origin input for supply and demand zone trading. We also provide the screenshot of how to do it in your chart. We hope this article is useful.
Below is link to Ace Supply Demand Zone Indicator.
https://www.mql5.com/en/market/product/40076
https://www.mql5.com/en/market/product/40075
https://algotrading-investment.com/portfolio-item/ace-supply-demand-zone/

: