Issam Kassas / プロファイル
- 情報
|
3 年
経験
|
101
製品
|
320
デモバージョン
|
|
0
ジョブ
|
0
シグナル
|
0
購読者
|
Note: Support is provided only on the MQL5 platform.
You can also find answers to all your questions in this SQRG: https://www.mql5.com/en/blogs/post/757873
Stay up to date with new updates by joining our mql5 channel: https://www.mql5.com/en/channels/smartts
Stay ahead of the markets with the **MENA Trend Indicator & Scanner** – designed to identify high-probability trends with precision. Perfect for traders looking for **fast, accurate signals** and **seamless market scanning**.
✅ **Real-time trend detection**
✅ **Powerful multi-timeframe scanning**
✅ **User-friendly & customizable alerts**
Don’t miss out! Elevate your trading game today. 💹🔥
🎥 Watch the Full Video Now! ⬇️📌 Link Below:
https://www.youtube.com/watch?v=QjIEhHxWfmM
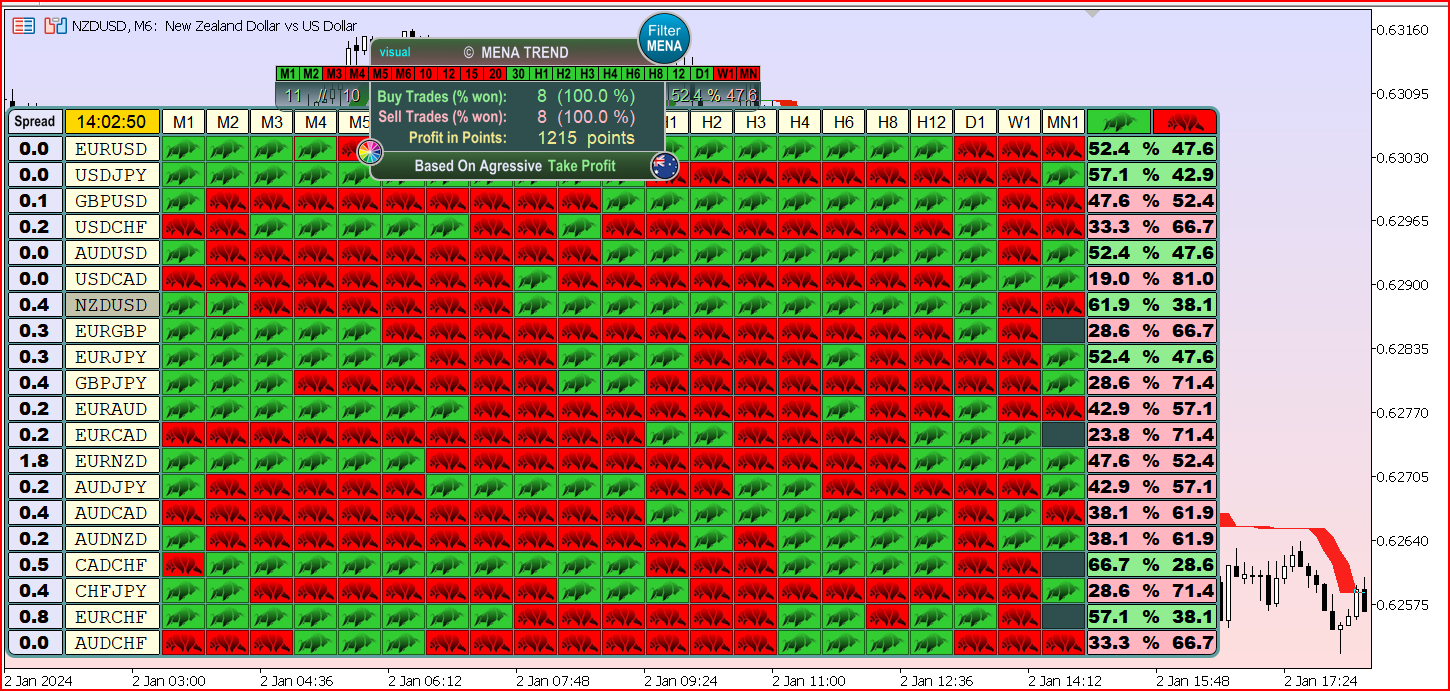
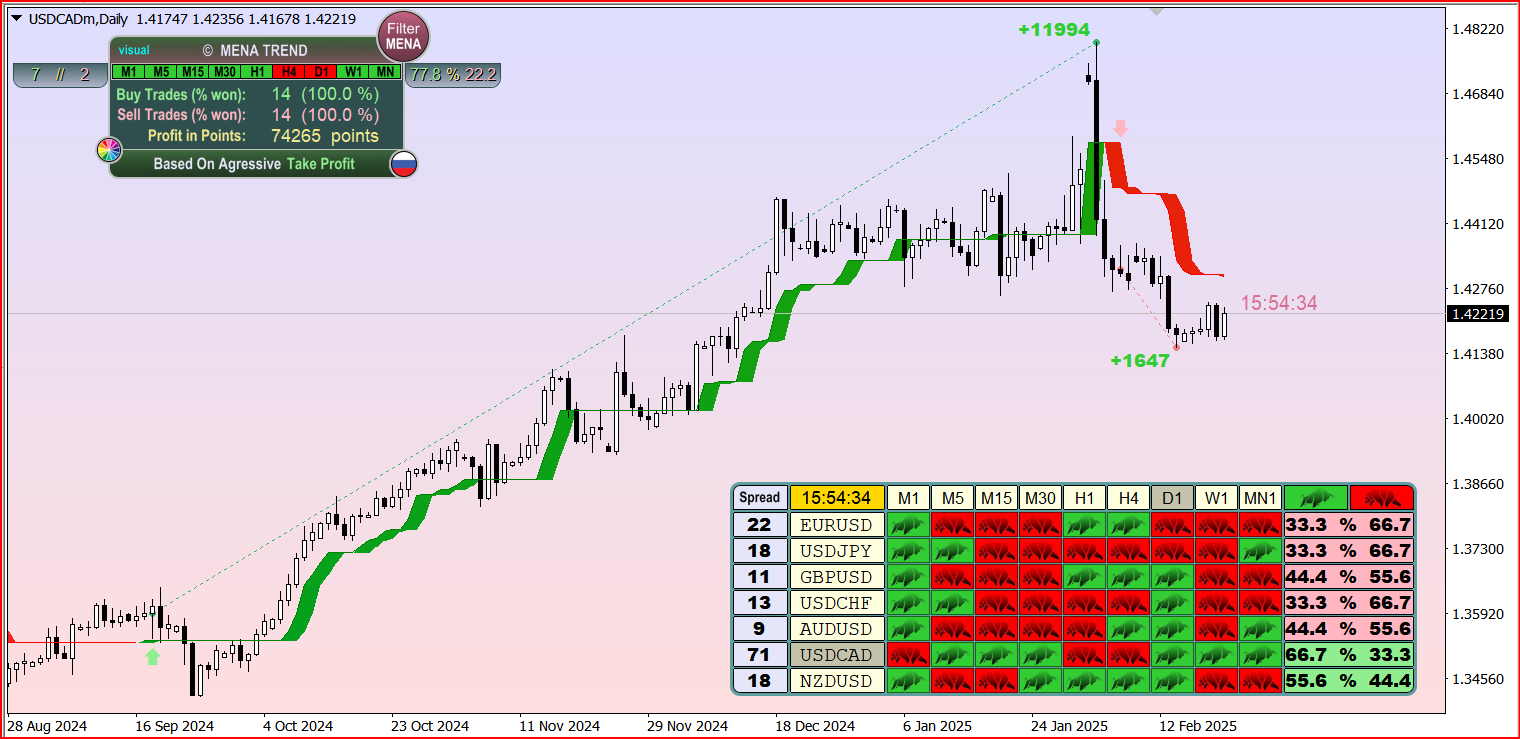
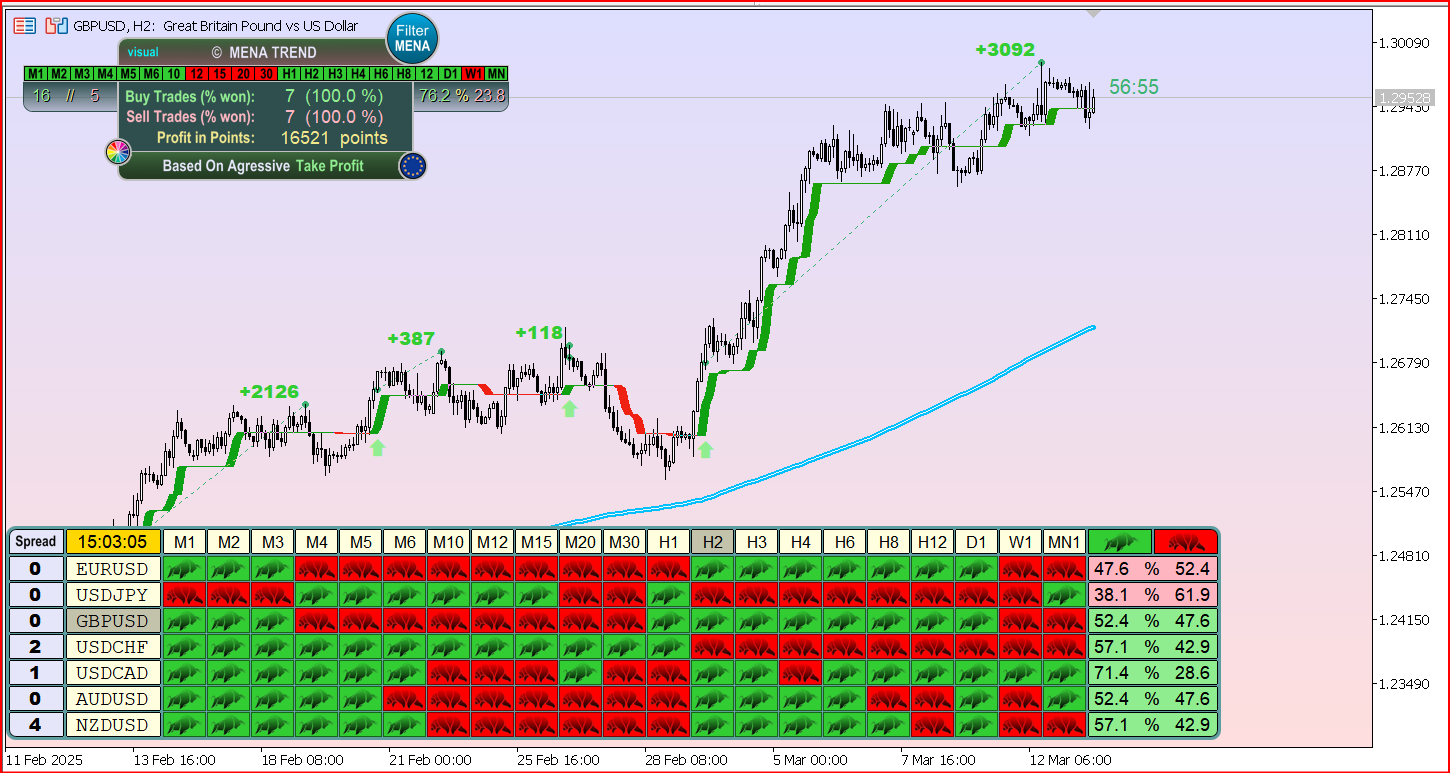
MENA TREND INDICATOR & SCANNER 複数時間軸におけるトレンド分析および取引実行ツール MENA TREND INDICATOR & SCANNER は、市場分析を 視覚的かつ構造化された方法 で簡素化し、トレンドの特定と取引の実行を支援するために設計された、総合的なトレーディングソリューションです。本ツールは、 リアルタイムのトレンド検出、複数時間軸での分析、取引パフォーマンスのモニタリング を統合しており、手動取引と自動取引の両方に適用可能です。 主な特徴 1. 複数時間軸のマーケットスキャナー M1からMN1まで、すべての時間軸におけるトレンドを同時に分析 します。 トレンドシグナルを一つの構造化されたパネルに統合 することで、分析時間を短縮します。 トレンドの変化や市場状況を 迅速に検知 します。 2. トレンドの視覚化 カラーコーディング を使用して、上昇相場、下降相場、レンジ相場を明確に区別します。 トレンドの変化は チャート上に直接表示 され、迅速な意思決定をサポートします。 市場動向の分析が 整理され、視覚的なノイズを排除
MENA TREND INDICATOR & SCANNER 複数時間軸におけるトレンド分析および取引実行ツール MENA TREND INDICATOR & SCANNER は、市場分析を 視覚的かつ構造化された方法 で簡素化し、トレンドの特定と取引の実行を支援するために設計された、総合的なトレーディングソリューションです。本ツールは、 リアルタイムのトレンド検出、複数時間軸での分析、取引パフォーマンスのモニタリング を統合しており、手動取引と自動取引の両方に適用可能です。 主な特徴 1. 複数時間軸のマーケットスキャナー M1からMN1まで、すべての時間軸におけるトレンドを同時に分析 します。 トレンドシグナルを一つの構造化されたパネルに統合 することで、分析時間を短縮します。 トレンドの変化や市場状況を 迅速に検知 します。 2. トレンドの視覚化 カラーコーディング を使用して、上昇相場、下降相場、レンジ相場を明確に区別します。 トレンドの変化は チャート上に直接表示 され、迅速な意思決定をサポートします。 市場動向の分析が 整理され、視覚的なノイズを排除
A Simple Visual Indication of the Trading Sessions Times. This Indicator will help you Visualize the Trading sessions and take advantage of the session precise timing to trade at the open of each session where there might be more liquidity. This Indicator is FREE, So pls Dont forget to leave a 5 * stars Review, This Will help me create new Ideas and Indicators and Upload them to the Market. More Professional and useful Indicators and tools here:
A Simple Visual Indication of the Trading Sessions Times. This Indicator will help you Visualize the Trading sessions and take advantage of the session precise timing to trade at the open of each session where there might be more liquidity. This Indicator is FREE, So pls Dont forget to leave a 5 * stars Review, This Will help me create new Ideas and Indicators and Upload them to the Market. More Professional and useful Indicators and tools here:
