I began my trading career in the options pits on the trading floor of LIFFE in 1987 at the age of 19, making markets on my own account. In 2001 when the trading floor closed I successfully made the transition to day trading on computer screens. Trading financial markets is all I have ever done, every day for over 25 years.

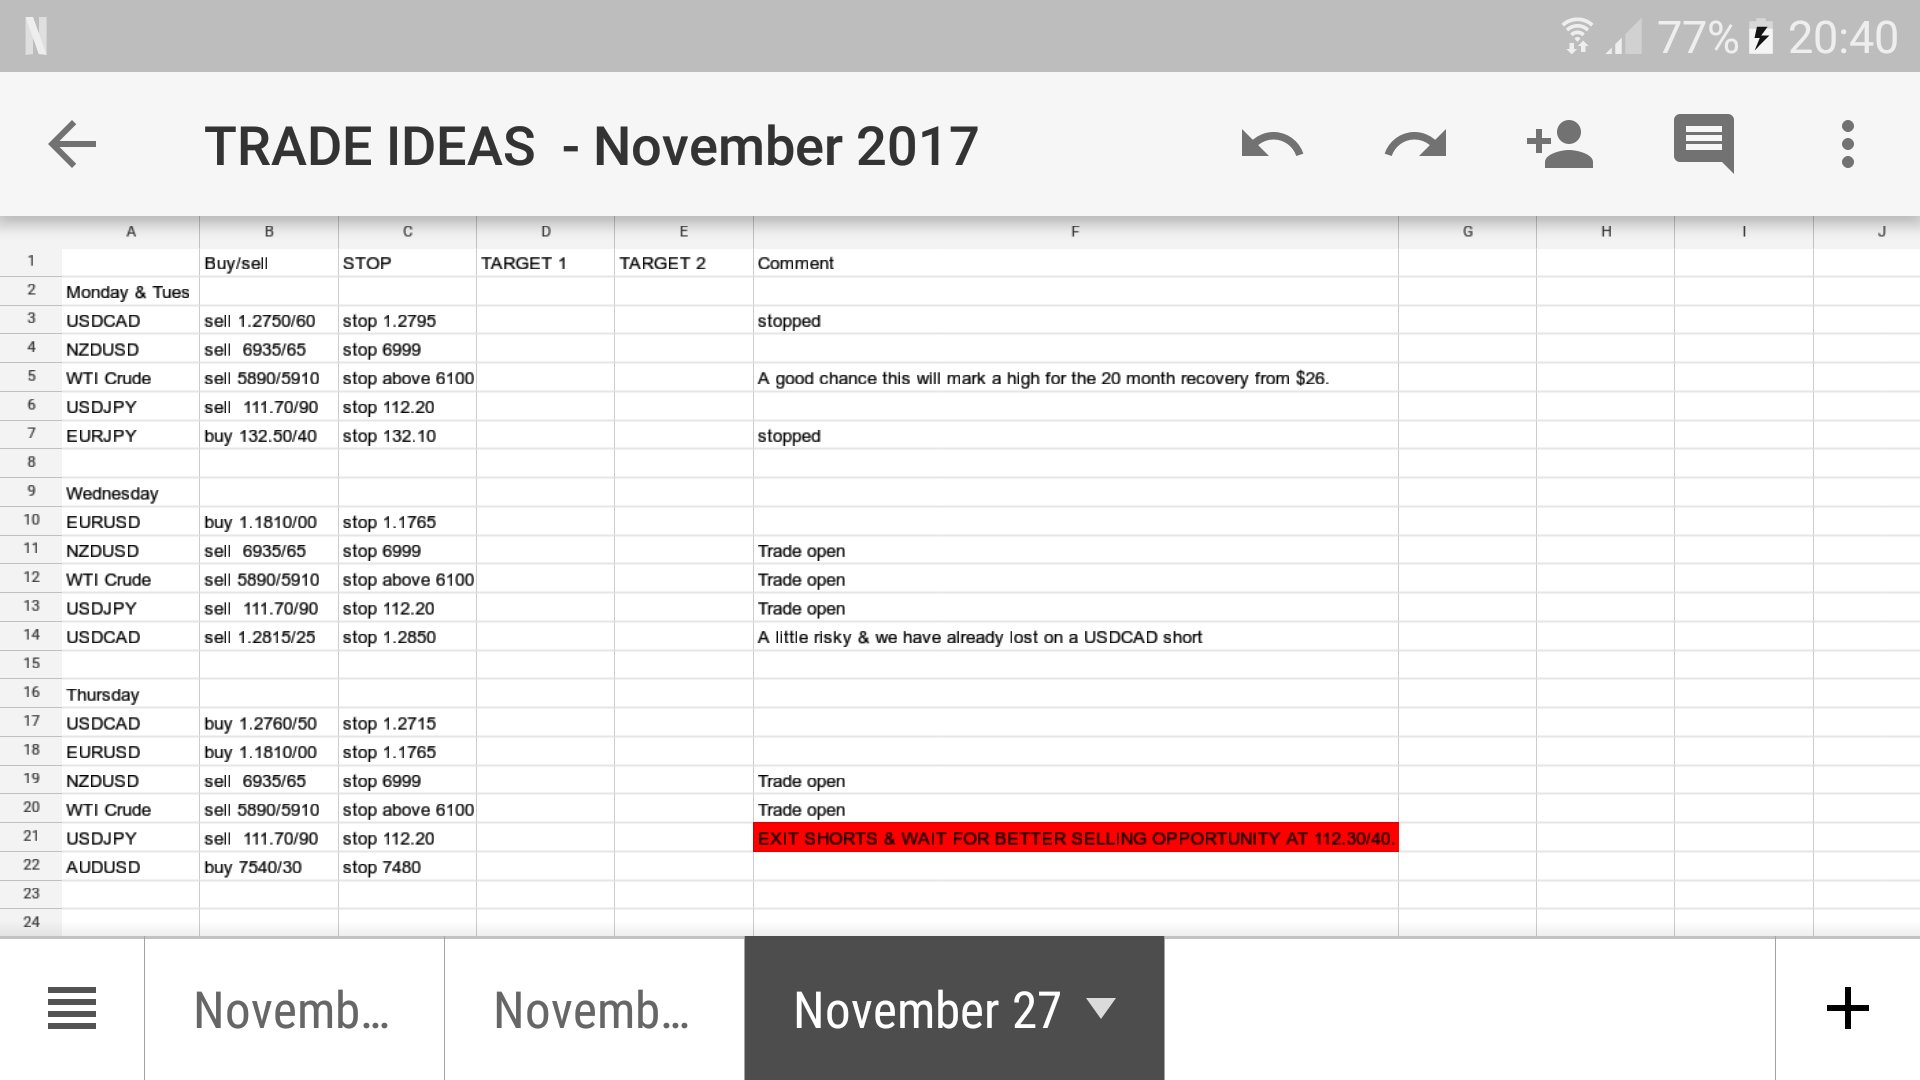
I use this experience to advise traders at the largest global investment banks & brokers, including Deutsche Bank, Morgan Stanley and Bank of America. I am the leading provider of daily technical analysis to Marex Spectron, Tower Trading Group and Schneider Trading, the main direct market access providers to thousands of professional traders in the UK and around the globe. I provide pin point entry, exit and target levels for day traders to give them the edge, helping them to maximize profits and minimize losses.
Jason Sen
Jason Sen
https://youtu.be/72bgHj8nays

In this installment of Technical Tuesdays Jason Sen covers Average True Range. The Average True Range or ATR as most traders call it is a very helpful and simple to use trading tool. Average True Range is simply a measure of volatility that takes the trading range of a set period of time and divides by that period to find the average range. Generally, traders use this tool on the daily chart and cover 14 days as their range. Even though the ATR was originally designed for commodities it can be used for all asset classes including: Forex, stocks, commodities, and options. For more excellent trading related information make sure to check out our website: http://www.daytradeideas.co.uk.
Jason Sen
Jason Sen
The holiday season is starting early!

Today, we released one full day of reports on our website completely for free. Reports for: USDJPY, EURJPY, EURUSD, USDCAD, Stoxx, Dow Jones, Bund, AUDUSD, NZDUSD, DAX, Bitcoin, and S&P500 have all been uploaded to the site. If you have ever been curious about a report or wanted to test us without paying a single cent then this is your chance. Today is an excellent day to see exactly the depth of analysis our subscribers get every single day before the trading day starts. This allows them to be fully prepared as they enter the trading day and look to make those valuable pips.

http://www.daytradeideas.co.uk/free-reports/
Jason Sen
Jason Sen
Episode 5 - Technical Tuesdays The stochastic oscillator is a momentum indicator comparing the closing price of a security to the range of its prices over a certain period of time. The sensitivity of the oscillator to market movements is reducible by adjusting that time period or by taking a moving average of the result. As designed by Lane, the stochastic oscillator presents the location of the closing price in relation to the high and low range of the price over a period of time, typically a 14-day period. The oscillator follows the speed or momentum of price. It is used a lot to identify overbought and oversold markets.

https://www.youtube.com/watch?v=IlXEFiAdvyI&t
Jason Sen
Jason Sen
Learn how you can get pinpoint entry, stops and targets at www.daytradeideas.co.uk
Jason Sen
Jason Sen
Emini Dow Jones Dow 30 holding below first resistance at 24240/230 (we topped exactly here on the bounce) re-targets 24135/125 before yesterday's low at 24083 and hopefully as far as support at 24045/035 for a buying opportunity. Stop below 23990. Further losses target 23890 but look for an excellent buying opportunity at 23740/720.

First resistance at 24230/240 but above here targets 24325/335 then 24385/395 before the all time high at 24536. A break above 24550/56 targets 24760/780 and 24970/990.

https://www.investing.com/analysis/emini-dow-jones-daily-forecast--07-december-2017-200271219?ampMode=1
Jason Sen
Jason Sen
FTSE 100

Strong Buy outlook negative as along as we hold below 7330 targeting 7305/00 (hit as I write) then a retest of 7280/75. A break lower targets 7240/35. On further losses look for 7190 before good support at 7170/60.
First resistance at 7341/45 but above here re-targets the high this week at 7369/72 before quite strong resistance at 7385/90. Above 7400 however targets 7412/18 then a selling opportunity at 7445/50.

https://www.investing.com/analysis/ftse-daily-forecast--06-december-2017-200270852?ampMode=1
Jason Sen
Jason Sen
This week's Premium FX subscribers TRADE SHEET. Learn more at: www.daytradeideas.co.uk
Jason Sen
Jason Sen
Live Support & Resistance trade calls and the logic behind why I selected these.

https://www.youtube.com/watch?v=OocbiT_ZKtQ
Jason Sen
Jason Sen
Obvious technical patterns no longer seem to work as often. Is it possible that social media is causing this? In this episode of Technical Tuesdays Jason Sen highlights several good examples of obvious technical patterns that did not work, as well as several not obvious technical patterns that did work. Is it possible that retail traders hyping up obvious technical patterns on social media is causing them not to work and for the retail trader to lose money? With technology advancements now a days institutional traders can easily listen in on social media platforms to gauge what the retail community is doing. Then, because they have deep pockets they are able to squeeze the retail trader until they break. The most recent example of this was the head and shoulders technical pattern on the EURUSD. It was obvious, retail traders pumped it up on social media, and that is when the short squeeze began. The market swiftly rejected the head and shoulders pattern and caused anyone short to get liquidated.

https://youtu.be/QeHGv43Lr8I
Jason Sen
Jason Sen
Weekly outlook video for: EURUSD, EURJPY, GBPUSD, AUDUSD, USDJPY, USDCAD, NZDUSD, Emini S&P, WTI Crude, and Bitcoin (BTCUSD)

https://www.youtube.com/watch?v=yoAiL2co7AY&t
Jason Sen
Jason Sen
Technical Tuesdays - Episode 5

Head and Shoulders is often used incorrectly, which is why many traders believe it does not work. In this episode of Technical Tuesdays Jason Sen explains how to properly spot the Head and Shoulders pattern, and trade it with a high degree of accuracy.

Make sure to join our free Facebook group to get real time views on the markets and how to apply the knowledge from this video.

https://youtu.be/o06ppjR4v04
Jason Sen
Jason Sen
#Bitcoin we wrote:
Holding first support at 6970/40 targets 7110/20 before the 7330/55 high. Bulls in full control of course so a break higher targets 7440/50, 7550/60 & 7740/80.

Initially we shot higher to to 7500 & then bottomed just 24 pips above first support at 6790/40 on some profit taking. We then topped just 30 pips above the next target of 7550/60.

Bitcoin topped 30 pips above the 7550/60 target in severely overbought conditions. Despite this there is no reason to short but letting up on some longs positions if you are holding them may be wise. If prices do turn lower we meet support at 7160/20. On further losses look for 7000/6990 then a buying opportunity at 6920/6900. Longs need stops below 6800.

A break above the all time high of 7590 targets 7780/7820 & perhaps as far as 8070/8100.
Jason Sen
Jason Sen
Are you lost trading Bitcoin?
Jason Sen
Jason Sen
Properly using the Fibonacci Series

Technical Tuesdays - Episode 4

In this episode of Technical Tuesdays Jason Sen covers Fibonacci Retracements. Fibonacci levels are one of, if not the best technical indicator tool available. We don't really know why they work so well, maybe it is because so many traders use them, but Fibonacci levels work extremely well in trading. Jason uses current market conditions in the EURUSD to explain the powerful impact this tool has.

https://youtu.be/zspxDKGUfYA
Jason Sen
Jason Sen
USD/JPY Analysis for October 26th, 2017

I have to admit the USDJPY has been confusing around the trend line. We topped 10 pips from quite important resistance at 114.35/45 with a negative candle acting as a sell signal. I feel more confident shorts will work now.

USDJPY sell signal as we hold quite important resistance at 114.35/45 should trigger losses in the end of the week. Holding below 113.65/60 targets minor support at 113.25. Below 113.15 then targets 112.95 & a buying opportunity at 112.70/60. A bounce from here is expected but longs need stops below 112.35.
Important resistance at 114.35/45 is key to direction. Try shorts with stops above 114.65. An unexpected break higher however targets 114.86/90 & 115.15/20.

More information can be found at: http://www.daytradeideas.co.uk/forex-technical-analysis-usdjpy
Jason Sen
Jason Sen
Bitcoin Analysis for October 25, 2017

Bitcoin lower this week exactly as predicted to our target & buying opportunity at 5430/5400. Try longs with stops below 5300. An unexpected break lower today however targets 5170/60, perhaps as far as last week's low at 5101. There are risks of further losses to an excellent buying opportunity at 4960/20.

Holding 5430/5400 targets 5530/40 & probably as far as first resistance at 5700/5750. We should struggle here but above 580 allows a recovery towards 6000/6050 before the all time high at 6140/6180. A break above 6200 targets 6270/90 then 6500.
Jason Sen
Jason Sen
How to use Bollinger Bands

In the third installment of Technical Tuesdays, we discuss Bollinger Bands.

https://youtu.be/PD3VG-bzX68
Jason Sen
Jason Sen
How to use Bollinger Bands

In the third installment of Technical Tuesdays, we discuss Bollinger Bands.

https://youtu.be/PD3VG-bzX68
123