Christoph Kreher / 販売者
パブリッシュされたプロダクト
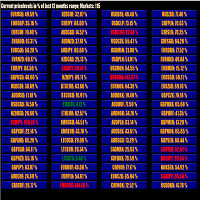
This tool scans up to 200 markets simultaneously and displays the current price level in a range specified by the user in a chart window.
By clicking on one of the buttons, a new chart window opens for the selected symbol. A template file can be specified as an input parameter, which is applied directly to the opened chart window.
The user can specify the font size of the buttons, the number of buttons per column and the level at which marking should take place in the input parameters. The upd
FREE
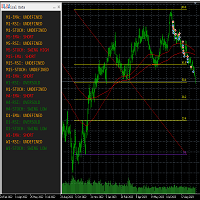
This tool helps to get a quick overview of a market. In one panel, indicators show trend, swing highs/lows and overbought/oversold information of various time frames (M1,M5,M15,H1,H4,D1,W1). Fibonacci can be used to identify different price levels. The input parameters of all indicators can be set by the user. The time frames can be changed as desired. The user can decide for himself which indicators he would like to see in the panel. Fibonacci appears on the chart at the next minute change at t
FREE
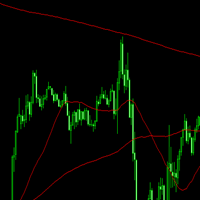
Simple EA with 3 SMAs. The Expertadvisor can be run in either “TREND” or “RETRACE” mode. In trend mode, it opens positions in the direction of the movement of the base moving average. In retrace mode, it opens positions in anticipation of the price moving back to the base moving average. It depends on the market in question which mode and which parameters to use. The EA is programmed in such a way that optimization runs consume little time.
A news filter and filter by day of the week are built

Simple EA with 1 SMA and Fibonacci. The Expertadvisor opens positions in the direction of the trend when price levels have exceeded or fallen below the Fibonacci levels.
It depends on the market in question and which parameters to use. The EA is programmed in such a way that optimization runs consume little time.
A news filter and filter by day of the week are built in.
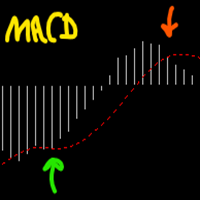
Simple EA with 1 SMA and MACD. The Expertadvisor opens positions in the direction of the trend when MACD value crosses MACD signal line in a special constellation.
It depends on the market in question and which parameters to use. The EA is programmed in such a way that optimization runs consume little time.
A news filter and filter by day of the week are built in.
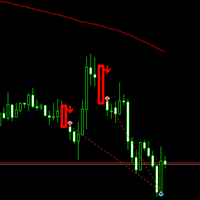
Simple EA with 1 SMA and Engulfing candlestick pattern. The Expertadvisor opens positions when the price closes above or below a moving average and the candlestick pattern engulfing has been previously identified.
It depends on the market in question and which parameters to use. The EA is programmed in such a way that optimization runs consume little time.
A news filter and filter by day of the week are built in.
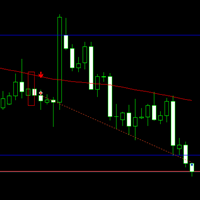
The Expert Advisor uses an SMA and Engulfing Candlestick Pattern as a signal and opens positions when the price closes above or below a moving average and the candlestick pattern engulfing has been previously identified. It then uses a simple grid strategy if the position turns into a loss. Grid levels can be defined specific to the market. User can set "positive Swap Only"-Mode to reduce trading costs for positions that may need to be held for a longer period of time.
A news filter and filter b
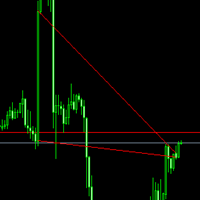
The Expert Advisor uses an Triangle Pattern as a signal and opens positions when the triangle and the price action reach a certain constellation. It then uses a simple grid strategy if the position turns into a loss. Grid levels can be defined specific to the market. User can set "positive Swap Only"-Mode to reduce trading costs for positions that may need to be held for a longer period of time. A news filter, filter by day of the week and fibonacci pricelevel filter are built in. It depends on
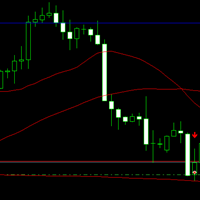
Simple EA with 3 SMAs and Grid. The Expertadvisor can be run in either “TREND” or “RETRACE” mode. In trend mode, it opens positions in the direction of the movement of the base moving average. In retrace mode, it opens positions in anticipation of the price moving back to the base moving average. It then uses a simple grid strategy if the position turns into a loss. Grid levels can be defined specific to the market. User can set "positive Swap Only"-Mode to reduce trading costs for positions tha
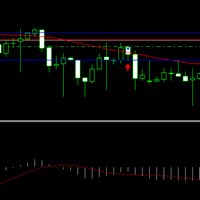
Simple EA with two indicators (SMA + MACD) and Grid. The Expertadvisor opens positions in the direction of the trend when MACD value crosses MACD signal line in a special constellation. It then uses a simple grid strategy if the position turns into a loss. Grid levels can be defined specific to the market.
It depends on your personal preferences and the respective market which parameters should be set and how. You have to test it yourself. The EA is programmed in such a way that optimization ru
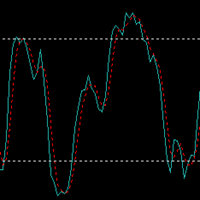
Simple EA with two indicators (SMA + STOCHASTIC) and Grid. The Expertadvisor opens positions in the direction of the trend when the lines of the Stochastic indicator intersect in the swing high or swing low area. It then uses a simple grid strategy if the position turns into a loss. Grid levels can be defined specific to the market.
It depends on your personal preferences and the respective market which parameters should be set and how. You have to test it yourself. The EA is programmed in such
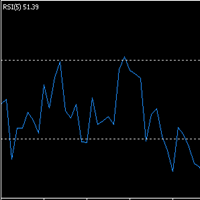
Simple EA with two indicators (SMA + RSI) and Grid. The Expertadvisor opens positions in the direction of the trend when the RSI line turns above 80 or below 20. It then uses a simple grid strategy if the position turns into a loss. Grid levels can be defined specific to the market.
It depends on your personal preferences and the respective market which parameters should be set and how. You have to test it yourself. The EA is programmed in such a way that optimization runs consume little time.
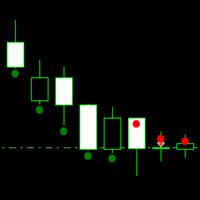
Simple EA with an self-made indicator and Grid. The Expertadvisor opens positions when the market behavior changed from bullish to bearish or vice versa. To determine the market behavior the indicator simply measures how many points it has moved up and down for the last X candles.
It then uses a simple grid strategy if the position turns into a loss. Grid levels can be defined specific to the market.
It depends on your personal preferences and the respective market which parameters should be se
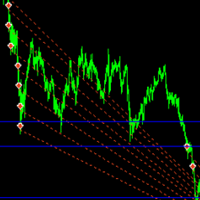
This EA creates pending orders in a grid when the price falls or rises below or above an EMA. The “aggression” parameter can be used to set whether or to what extent the lot size should increase in the grid. The price must have moved x% from the EMA before the grid is created. If the price has moved too far away from the EMA by y%, the grid will not be created. The grid distance can be specified in %. A stop loss is set and tightened based on the EMA with an offset/shift to be defined.