Daying Cao
Daying Cao
4 (12)
  • 情報
7+ 年
経験
115
製品
51
デモバージョン
0
ジョブ
0
シグナル
0
購読者
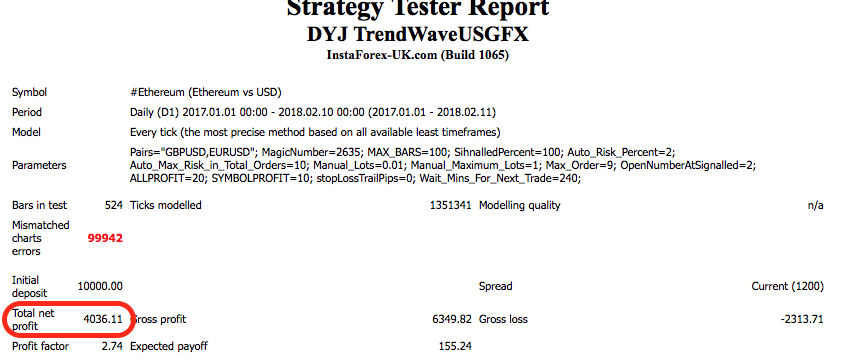
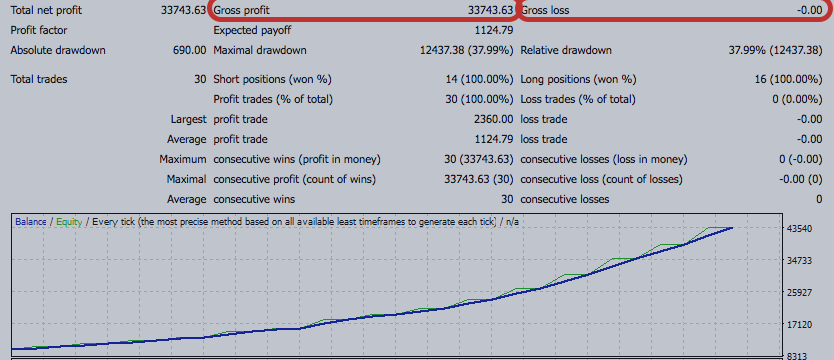
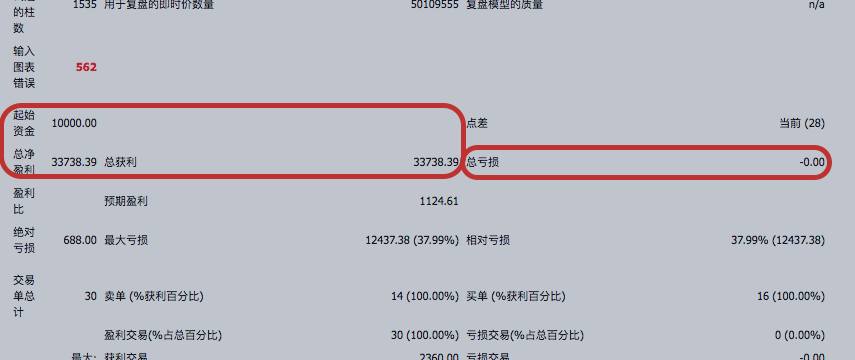
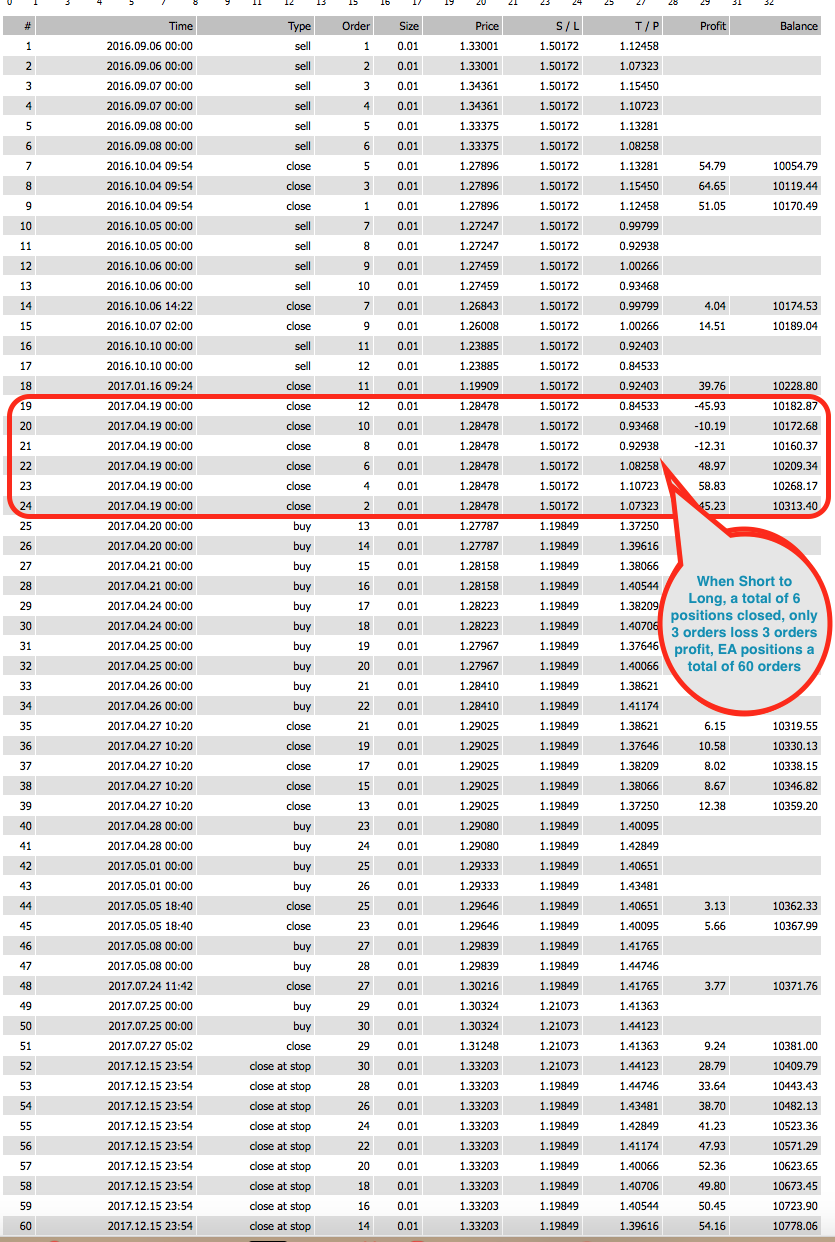
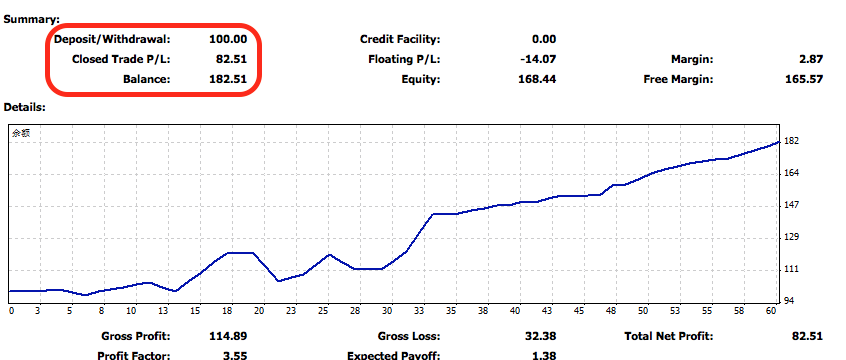
こんにちは! 私はソフトウェアエンジニアが長年にわたって開発してきました。独自のトレーディングシステムを持ち、豊富なEA取引経験を持っています。 主な通貨はEUR / USD、GBP / USDです。 USD / JPY、AUD / USD、USD / CAD、金、EUR / NZDクロス通貨。 EAは、トレンドを識別するために実行して、一日10ドル以上の最大10%以上の、20%の最大リトレースメント、マーチンゲイルアルゴリズムを使用して、月間収入10%-20%を使用して、 どのブローカーのビジネスにも従うことができます、それは滑りやすい点を減らすためにENCアカウントを使用することをお勧めします。 独身では、私たちは取引システムと恋に落ちると信じています。 ありがとうございました!!

我々は今、歴史の価格チャートの代わりに通貨ごとの将来にゲーム理論の戦略を適用します。これは1つのレベルが高いです。動的市場ゲーム理論は先進的な通貨の健康バーの指標の特別な機能であり、他の通貨メートルで見つけることができない!これは非常にユニークな機能です。ダイナミックマーケットゲーム戦略戦略健康バーは、全市場活動(全35組)に基づいています。
このEAは私の数学的アルゴリズムを通して将来の損失率を修正することができます。


DYJのトレーディング商品は、企業顧客の目的の実装だけでなく、独自のニーズのための取引分野における革新的なマルチ通貨ソフトウェア開発を専門としています。
詳細は、 https://www.mql5.com/en/users/cdymql4 または https://www.mql5.com/zh/users/cdymql4 を参照してください。


お客様各位、当社の有料製品はすべて購入およびレンタル可能です。

DYJ RiseTrading MT4: https://www.mql5.com/en/market/product/25237

StrongCurrency MT4: https://www.mql5.com/en/market/product/23311,orf https://www.mql5.com/zh/market/product/23311
StrongCurrency MT5: https://www.mql5.com/en/market/product/24025,orf https://www.mql5.com/zh/market/product/24025

PowerSignal MT4:/en/market/product/24448#description%E3%80%81%E3%81%BE%E3%81%9F%E3%81%AF https://www.mql5.com/zh/market/product/24448#description
PowerSignal MT5: https://www.mql5.com/en/market/product/24915 、または https://www.mql5.com/zh/market/product/24915

SoarSignal MT4: https://www.mql5.com/en/market/product/22459#description,or https://www.mql5.com/zh/market/product/22459#description
SoarSignal MT5: https://www.mql5.com/en/market/product/24638 、または https://www.mql5.com/zh/market/product/24638

DYJ TwoMACrossAlarm MT4:/en/market/product/25213,%e3%81%be%e3%81%9f%e3%81%afdyj TwoMACrossAlarm

クイッククローズMT4:/en/market/product/22425#description%E3%80%81%E3%81%BE%E3%81%9F%E3%81%AF https://www.mql5.com/zh/market/product/22425#description
Daying Cao パブリッシュされたプロダクト

DYJTRENDWAVE features an advanced algorithm that detects new trends and current trend continuations for use as an entry strategy. DYJTRENDWAVE's volatility is based on the power of buyers and sellers, it grabs total body size of candles and identifies the battle between buyers and sellers as a percentage of the total volume, like Sellers: (-)100% and Buyers: (+)100%. This information can be used for any entry and exit strategy. For bullish/Long Pin bar it is below the price line, for

Daying Cao
Advanced DYJ TrendWave is the result of more than 3 years of studying the markets and programming expert advisors. It uses very advanced trend-wave algorithms and has a build in spread-filter...
Daying Cao
With the single signal 60 dollars per month:https://www.mql5.com/zh/signals/386558 With the single signal 40 dollars per month:https://www.mql5...
Daying Cao
跟单信号每月60美元:https://www.mql5.com/zh/signals/386558 跟单信号每月40美元:https://www.mql5...
Daying Cao
Daying Cao
The "DYJ SHARP" EA GBPUSD performance saw a total of 60 orders, the trend turned from short to long, the same time Close 6 orders, 3 orders loss 3 orders profit, the actual turning point Close 6 orders without loss and profit, the remaining short order And long orders all profit, profit and loss curve is very smooth.
共有されたプロダクト

150.00 USD

DYJ Sharp advanced algorithm that detects new trends and current trend continuations for use as an entry and exit strategy. The strategy display the SHARP trend demarcation area. This SHARP area has high HighLine and low LowLine. Falling of high below HighLine of SHARP and then falling of close below LowLine of SHARP can be interpreted as a signal to sell. Rising of close above HighLine of SHARP and then rising of low above LowLine of SHARP can be interpreted as a signal to buy. The signal for

Daying Cao
DYJ Spiraling The DYJ Spiraling EA is based on DYJ Spiraling indicator,DYJ Spiraling advanced algorithm, using probability and mathematical statistics algorithm to calculate the Trend-wave of the p...
Daying Cao

DYJ Sharp趋势指标

23 1月 2018, 06:47
DYJ Sharp DYJ Sharp高级算法,可检测新趋势和当前趋势延续,策略可用于入场和出场信号。策略在图表里显示了SHARP分界区域,区域有高位价格线HighLine和低位价格线LowLine。当K线的收盘价向上穿越区域 HighLine价格时与最低价向上穿越区域LowLine价格时是上涨信号,当K线收盘价下穿区域LowLine价格与最高价下穿HighLine价格时是下跌信号...
Daying Cao パブリッシュされたプロダクト

150.00 USD

DYJ Sharp advanced algorithm that detects new trends and current trend continuations for use as an entry and exit strategy. The strategy display the SHARP trend demarcation area. This SHARP area has high HighLine and low LowLine. Falling of high below HighLine of SHARP and then falling of close below LowLine of SHARP can be interpreted as a signal to sell. Rising of close above HighLine of SHARP and then rising of low above LowLine of SHARP can be interpreted as a signal to buy. The signal for

Daying Cao
Daying Cao
DYJ Sharp advanced algorithm that detects new trends and current trend continuations for use as an entry and exit strategy.

The strategy display the SHARP trend demarcation area.This SHARP area has high HighLine and low LowLine.

Falling of high below HighLine of SHARP and then falling of close below LowLine of SHARP can be interpreted as a signal to sell.

Rising of close above HighLine of SHARP and then rising of low above LowLine of SHARP can be interpreted as a signal to buy.

The signal for each currency pair is shown in the LAST SIGNALLED field.

MT4, email and push alerts can be enabled.
Daying Cao
Daying Cao
DYJ Sharp高级算法,可检测新趋势和当前趋势延续,策略可用于入场和出场信号。策略在图表里显示了SHARP分界区域,区域有高位价格线HighLine和低位价格线LowLine。当K线的收盘价向上穿越区域 HighLine价格时与最低价向上穿越区域LowLine价格时是上涨信号,当K线收盘价下穿区域LowLine价格与最高价下穿HighLine价格时是下跌信号。每个货币对的信号显示在LAST SIGNALLED字段
Daying Cao
Daying Cao
DYJ Sharp高级算法,可检测新趋势和当前趋势延续,策略可用于入场和出场信号。策略在图表里显示了SHARP分界区域,区域有高位价格线HighLine和低位价格线LowLine。当K线的收盘价向上穿越区域 HighLine价格时与最低价向上穿越区域LowLine价格时是上涨信号,当K线收盘价下穿区域LowLine价格与最高价下穿HighLine价格时是下跌信号。每个货币对的信号显示在LAST SIGNALLED字段DYJ Sharp高级算法,可检测新趋势和当前趋势延续,策略可用于入场和出场信号。策略在图表里显示了SHARP分界区域,区域有高位价格线HighLine和低位价格线LowLine。当K线的收盘价向上穿越区域 HighLine价格时与最低价向上穿越区域LowLine价格时是上涨信号,当K线收盘价下穿区域LowLine价格与最高价下穿HighLine价格时是下跌信号。每个货币对的信号显示在LAST SIGNALLED字段
Daying Cao
Daying Cao
DYJ Sharp advanced algorithm that detects new trends and current trend continuations for use as an entry and exit strategy.

The strategy display the SHARP trend demarcation area.This SHARP area has high HighLine and low LowLine.

Falling of high below HighLine of SHARP and then falling of close below LowLine of SHARP can be interpreted as a signal to sell.

Rising of close above HighLine of SHARP and then rising of low above LowLine of SHARP can be interpreted as a signal to buy.

The signal for each currency pair is shown in the LAST SIGNALLED field.

MT4, email and push alerts can be enabled.DYJ Sharp advanced algorithm that detects new trends and current trend continuations for use as an entry and exit strategy.


The strategy display the SHARP trend demarcation area.This SHARP area has high HighLine and low LowLine.


Falling of high below HighLine of SHARP and then falling of close below LowLine of SHARP can be interpreted as a signal to sell.


Rising of close above HighLine of SHARP and then rising of low above LowLine of SHARP can be interpreted as a signal to buy.


The signal for each currency pair is shown in the LAST SIGNALLED field.


MT4, email and push alerts can be enabled.
Daying Cao
100本金 运行2周利润47.23美元,2017-01-08周一开盘就运行截止2017-01-19周五,https://www.mql5.com/zh/users/cdymql4/seller...
Daying Cao
DYJ Sharp高级算法,可检测新趋势和当前趋势延续,策略可用于入场和出场信号。策略在图表里显示了SHARP分界区域,区域有高位价格线HighLine和低位价格线LowLine。当K线的收盘价向上穿越区域 HighLine价格时与最低价向上穿越区域LowLine价格时是上涨信号,当K线收盘价下穿区域LowLine价格与最高价下穿HighLine价格时是下跌信号...
Daying Cao

Trend wave DYJ SHARP

16 1月 2018, 07:58
DYJ Sharp advanced algorithm that detects new trends and current trend continuations for use as an entry and exit strategy. The strategy display the SHARP trend demarcation area...
共有されたプロダクト

30.00 USD

This QuickClose help you to close all orders having profit immediately with only ONE CLICK, its work is very fast. You can choose which symbol you want or close all symbols so it will helpful for you in your trading to manage trading faster. This EA can quick close all Buy and Sell Orders by a selected symbol or total. This SymbolButton is designed for closing orders. There is available Manual and Automatic closing functions. Automatic closing function will close the orders according the

共有されたプロダクト

This indicator shows the crossing between two moving averages, a slower and faster moving average. Signal show alert pop-up, when MA1 crosses above the MA2. Signal show alert pop-up, when MA1 crosses below the MA2. Inputs Value Fast MA Setup Period = 5 - period of Faster Moving Average (value 5). Mode = SMA - type of Moving Average (SMA, EMA, SMMA, LWMA). Price = Close - type of price (Close, Open, Low, High, Median, Typical, Weighted). Slow MA Setup Period = 10 - period of Slower MA (value 10)

共有されたプロダクト

This indicator shows the crossing between three moving averages (slower, middle and faster ones). When fast MA crosses up middle MA and middle MA crosses up slow MA, the bullish alert is issued. When fast MA crosses down middle MA and middle MA crosses down slow MA, the bearish alert is issued. Signals to close buy positions are generated if fast MA crosses middle MA downwards, signals to close sell positions are generated if fast MA crosses middle MA upwards. Inputs Fast MA Setup MAPeriod1 = 5

共有されたプロダクト

The Expert Advisor is based on three Moving Average indicators. ThreeMACross is based on the following idea: crossing of three Moving Average lines (Fast, Middle and slow ones) is used as a signal for opening and closing a position together. Go Long when Fast MA (MA1) crosses above Middle MA (MA2), and Middle MA (MA2) crosses above Slow MA (MA3). Go Short when Fast MA (MA1) crosses below Middle MA (MA2), and Middle MA (MA2) crosses below Slow MA (MA3). Signals to close buy positions are