Abir Pathak
Abir Pathak
4.8 (150)
  • 情報
5+ 年
経験
38
製品
95
デモバージョン
0
ジョブ
0
シグナル
0
購読者
Abir Pathak
Features: The strategy looks for these engulfing candlestick pattern: Simple Engulf Stick Sandwich Engulf Three Line Strike Rising Three Morning Star Doji Scanner is useful to make your strategy better. Don't always go by Win/Loss percentage. Because this tool is not based on past results...
Abir Pathak パブリッシュされたプロダクト

Features: Find these engulfing patterns: Simple Engulf Stick Sandwich Engulf Three Line Strike Rising Three Morning Star Doji Scanner is useful to make your strategy better. Don't always go by Win/Loss percentage. Because this tool is not based on past results. Basic Settings: For All Patterns You can set: First:Last Candle Ratio This will make sure that the earlier opposite candle is at least this given ratio in height as compared to the engulfing candle. This is not checked for Three Line

Abir Pathak
This post explains all common settings for my series of Indicators which will calculate the SL/TP and show Win Rate Percentages. These indicators are not just scalpers, but are also for longer term trading on higher timeframes: Bollinger Bands Breakout Strategy: https://www.mql5...
Abir Pathak
Product page: https://www.mql5.com/en/market/product/78178 Video Tutorial: Bollinger Bands Breakout Strategy has an Arrows and Scanner Dashboard indicator set. It is for MT4 (Metatrader 4) platform...
Abir Pathak パブリッシュされたプロダクト

Bollinger Bands Breakout Strategy has an Arrows and Scanner Dashboard indicator set. It is for MT4 (Metatrader 4) platform. When price breaks out of a Bollinger Outer Band in a powerful way, it becomes a great position for scalping. Because the next few bars will most likely keep going in the same direction. Especially if Middle band is also sloping towards that breakout. It's also great for Binary options when using 2-3 next few bars. Strategy: BUY  Bollinger Bands: - Price breaks out of

Abir Pathak
This strategy is best used for Trend based trading. While market is trending, price still makes smaller ranges. Darvas boxes show breakouts from these small ranges, while still following the original market trend. Product page: https://www.mql5.com/en/market/product/61809/ or https://abiroid...
Abir Pathak パブリッシュされたプロダクト

This strategy is best used for Trend based trading. While market is trending, price still makes smaller ranges. Darvas boxes show breakouts from these small ranges, while still following the original market trend. Detailed Description: https://www.mql5.com/en/blogs/post/747919 Features: Darvas - Check Darvas Box Breakout -   Check Price Above/Below MA or Darvas Box has crossed MA -   Min, Max Box Height -   Max Distance Between Entry Price and Darvas Box Other Indicators: - NRTR

Abir Pathak パブリッシュされたプロダクト
レビュー: 1
45.00 USD

This strategy is best used for Scalping and Binary Options. Strategy: There are 3 EMAs: Faster, Medium and Slower. When Price is Trending, wait for Price to bounce an EMA and scalp at each bounce. Features: - Check if 3 MAs are Stacked - Check Price Bounce Off MAs (Faster, Medium, Slower) - Min Distance Between Faster and Medium MA Filter - Max Distance Between Entry Price and Faster MA Filter - High Volume Check - Heiken Trend Check - Volatility Check - Higher/Lower Timeframes MA Stacked check

Abir Pathak
This strategy is best used for Trend based trading, Scalping and Binary Options. If Scanner percent is very less, means pair is ranging and not trending and should be avoided Use fewer Max Past Bars in scanner like 100 or 500. To get most recent trend results. Free scanner: https://abiroid...
Abir Pathak
Features: Moving Average Slope for Max Past Bars Slope Period Slope Thresholds Multiple Slope Type options See slope visually as a histogram Info Panel Show/Hide Get free indicator here: https://www.mql5.com/en/market/product/77212/ Video tutorial: https://youtu...
Abir Pathak パブリッシュされたプロダクト
レビュー: 2
FREE

Features: - Moving Average Slope for Max Past Bars - Slope Period - Slope Thresholds - Multiple Slope Type options - See slope visually as a histogram - Info Panel Show/Hide Slope Calculations and Types: The slope value is calculated using the Slope Period. Suppose Period is 5, it will check the MA value for bar (x) and bar (x+5). And find the slope angle between them. Read detailed description about Slope Types and Settings here: https://www.mql5.com/en/blogs/post/747651

Abir Pathak
Understanding Semafors 3LZZ This post will help you understand the different terms in creating the 3LZZ Semafor (3 level zz semafors). I have used the 3LZZ_TRO_EXT.ex4 (MT4) in my examples here: Semafors: Unlike what it appears like in the chart, Semafors are not points of reversals...
Abir Pathak
パブリッシュされた投稿Profit Percent Series Common Settings
This post explains all the common settings for the Profit Percent Series Indicators: https://abiroid.com/product/profit-percent-stoch-ichimoku-with-atr and https://abiroid...
Abir Pathak
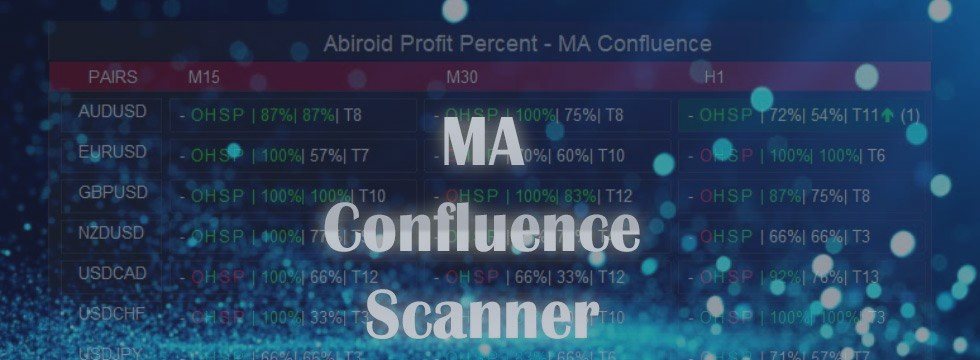
Download Demo: Abiroid_MA_Confluence_Arrow_Demo.ex4 Note: Demo only works for EURUSD. Download Extras: MA_Confluence_Extras.zip You can get Arrows from: Arrows: https://www.mql5.com/en/market/product/51078/ Scanner (free): https://abiroid...
Abir Pathak
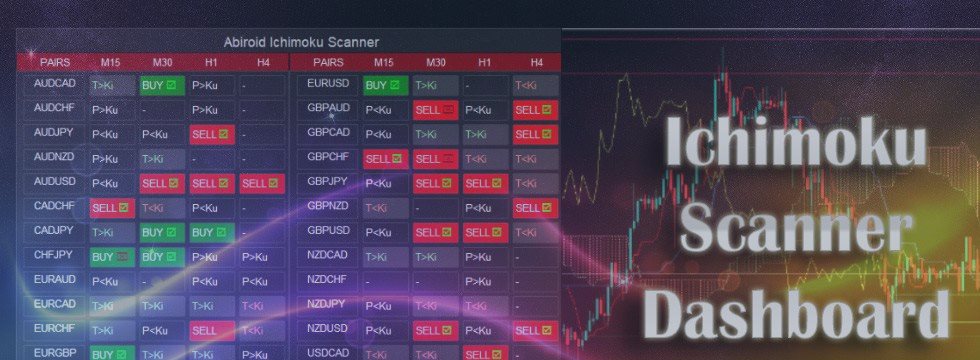
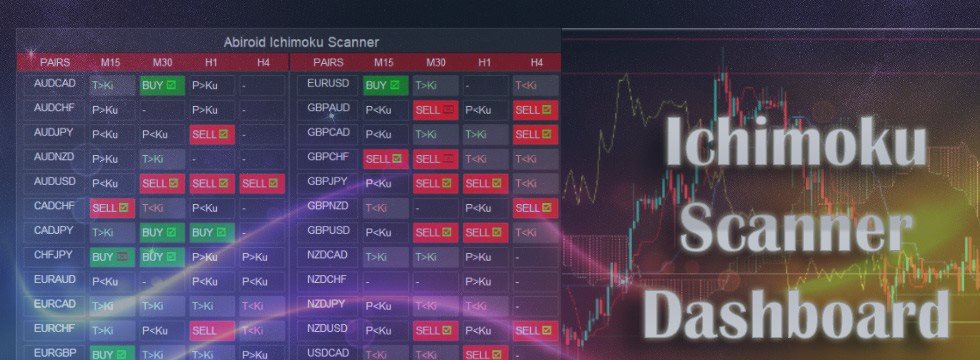
Ichimoku Scanner Dashboard is great for finding good Up/Down Trends based on your own Ichimoku Strategies: https://www.mql5.com/en/blogs/post/747457 https://www.mql5.com/en/market/product/41711 But here is a guide which will help you form good strategies...
Abir Pathak
Features: Price Kumo Breakout Tenkan-Kijun Cross Chikou/CLoud and Chikou/Price Support/Resistance (SR-SS or SR-NRTR) Stochastic OB/OS and back Awesome Oscillator Higher Timeframe Ichimoku Trend Align Description Detailed description: https://abiroid...
Abir Pathak
パブリッシュされた投稿Abiroid Scanners: How to Calculate Min Distances using Cross Hair Tool
Most of my scanners have Min/Max Distances in Points. For each different timeframes. So this blog post will be useful in understanding how to Calculate Minimum or Maximum Point distances using Cross Hair Tool in MT4. This is an example from Ichimoku Scanner Dashboard: https://www.mql5...
Abir Pathak
パブリッシュされた投稿Abiroid Common Scanner Dashboard Settings
This post describes Common settings for all Abiroid Scanner Dashboards. These are available on Metatrader’s Market: https://www.mql5.com/en/users/apat85 A scanner Dashboard indicator will scan multiple Pairs for Multiple Timeframes and it will show results for all...
Abir Pathak パブリッシュされたプロダクト

Description This scanner uses 3LZZ TRO ex4 and scans for Semafors at given “Shift” bar. Scanner Detailed Settings: https://www.mql5.com/en/blogs/post/747456 Other Settings: Set Periods for Semafor 1,2,3 Set alerts on/off for Semafor 1,2,3 Shift bar (Bar on which semafor is scanned) Refresh After Ticks (Number of ticks when dash is refreshed) This scanner is pretty simplistic version. And a more detailed version with a different strategy is available here

Abir Pathak パブリッシュされたプロダクト

This is a multi-timeframe multi-currency Fibo (Fibonacci levels) and Pivots scanner which also shows Missed Pivot count and Fibo Golden Ratio Zones. Select separate Pivot Timeframes for each Dashboard Timeframe Check when price is near a Pivot point Check for Price Crossing Pivot Point Use Mid Pivots (Optional) Show Missed Pivots (Optional) Show High Volume Bar Use Fibo (Optional) Use Fibo Golden Ratio (Optional) Set your preferred Timeframe for Fibo or Pivots Check out   Common Scanner