Damyan Malinov / プロファイル
- 情報
|
5+ 年
経験
|
10
製品
|
20
デモバージョン
|
|
0
ジョブ
|
0
シグナル
|
0
購読者
|
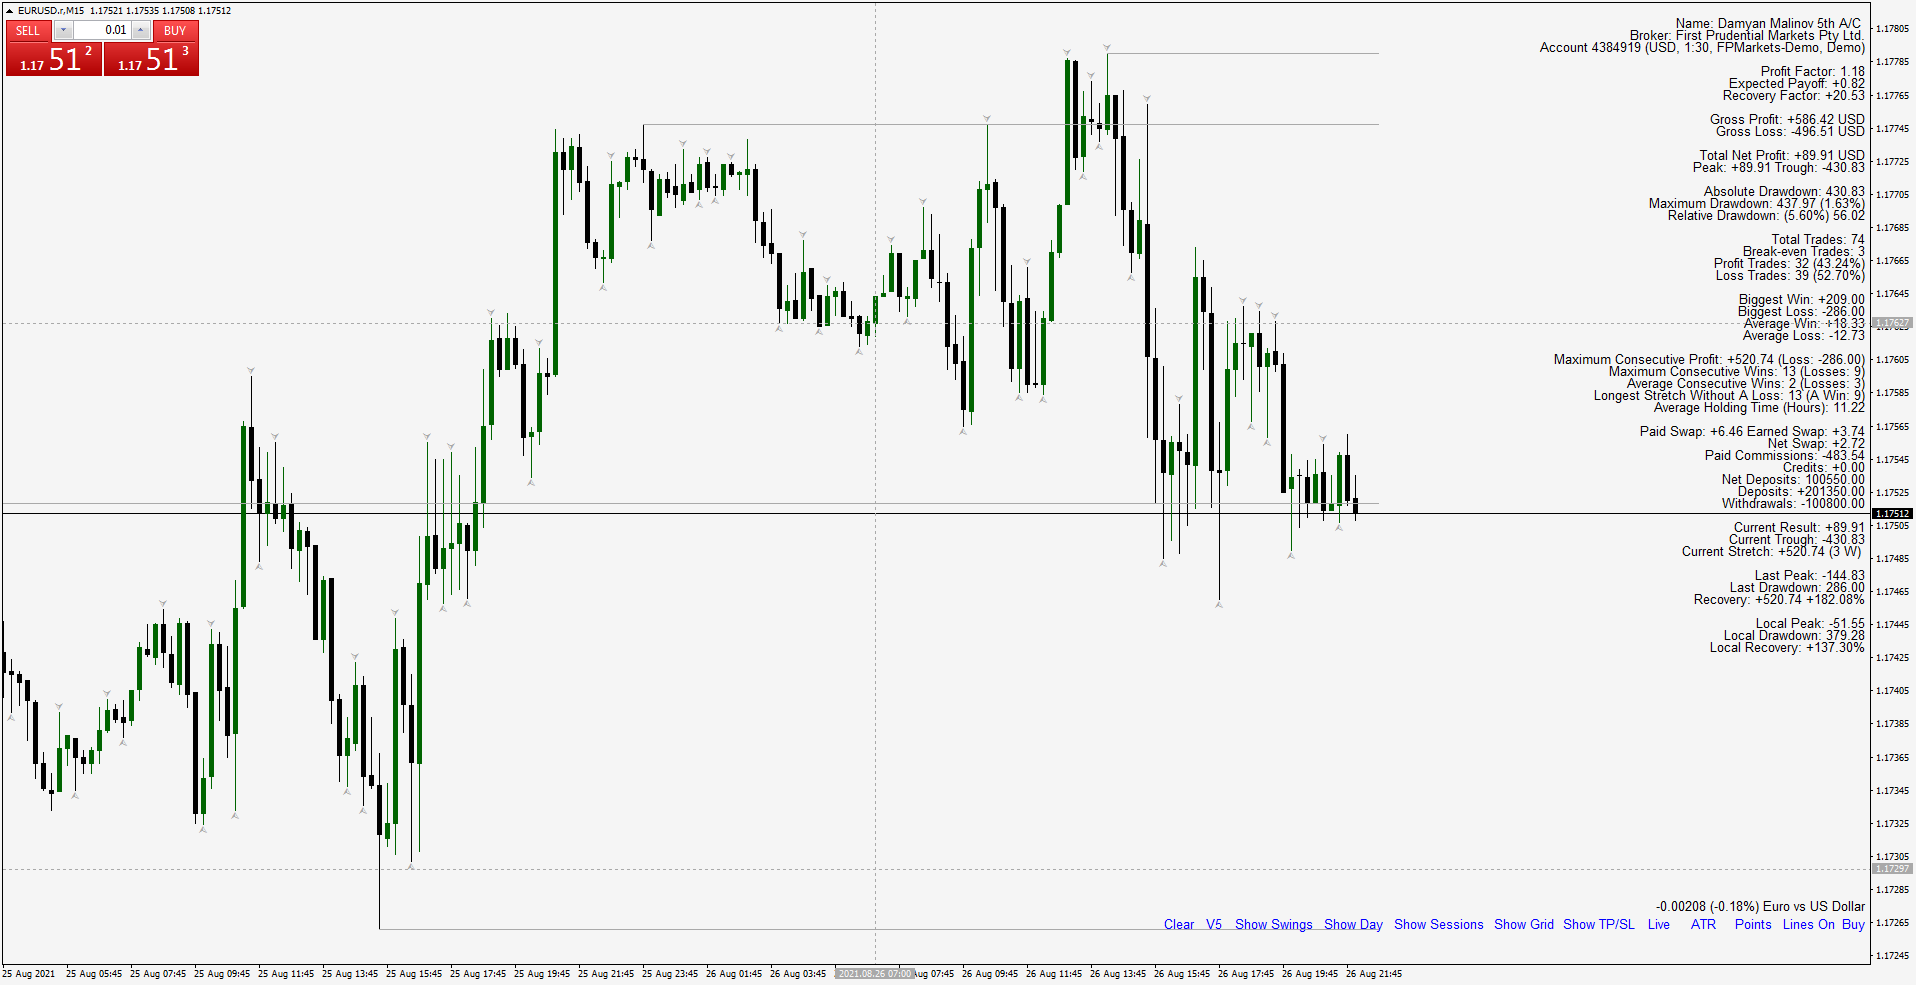
PSI tools delivers new special look aimed to bring Detailed Account Statement for all important statistics. The integrated MT4 is not accurate. It does not account correctly for Deposits, Withdrawals and completely ignores cases like hedged trades, break-even trades, other broker related credits, bonuses and so on events and as a result all statistics like draw-down, total trades, average win size, rate and so on are totally skewed. PSI corrects these mistakes. In the example below a demo

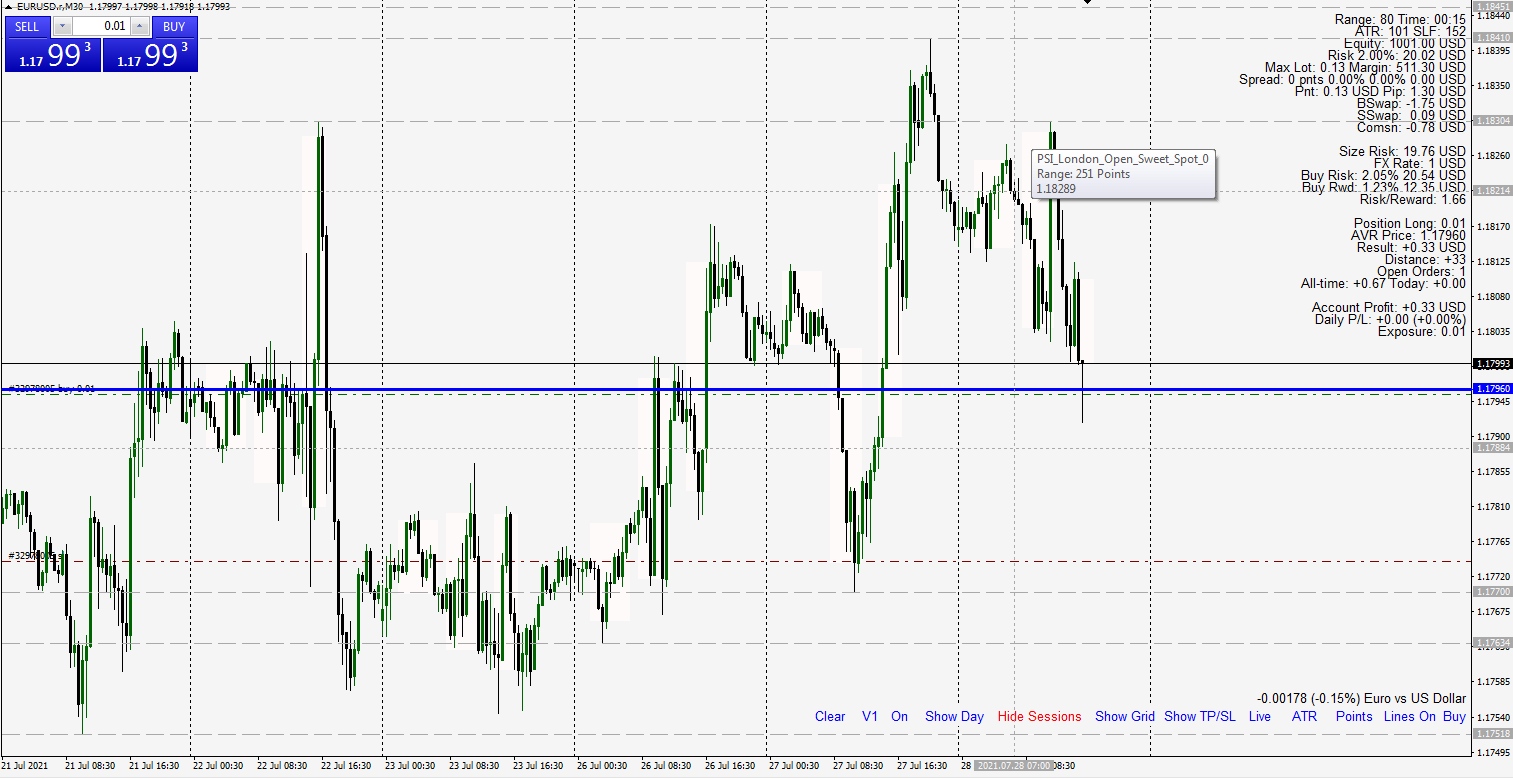
• Lots of improvements on the Forex Sessions and the Day on Focus ranges. Also added ICT Killzones with ability to focus the range on the majority of the volume (candle bodies) instead of the candle wicks.
• Added range labels for all sessions as well as other tool-tip descriptions for each plotted line or tool.
• Added special button layout with minimum names and space taken.
• Divided the tool different options in categories with most frequently changed options on top for better use and customization.
• Each category has basic explanation and credits the popular and original source for its inspiration. Research on these is recommended.
• New button for easy switch between primary and secondary favorite display options.
• New On/Off button to hide and to display the selected options. Useful if for a moment the user wants to hide the labels for more chart area.
• Added Vertical Line for the NY Midnight Open or any custom period.
• Also the AVR Price and Past Results have new abilities like:
- add dividends for past performance results;
- new other options for Allowed Margin tolerance on new trades;
- display spread as percentage from the current candle range;
PSI Cancel Pending script deletes pending positions. Check out also other free PSI scripts and indicators like adding Stop Loss , Take Profit Levels , closing Hedged Orders , Average Price , etc. Check out also the Position Smart Indicator - a powerful Money Management tool (and much more) both useful for Price Action and Algo traders . NEW check the FULL Version Including the private ICT tools limited so far until the release of the full 2016 Mentorship Core Content to the
PSI Close by Hedge script closes out balanced trades. It is much more easier and cost efficient to use hedges (limit order by the One Click Trading) to partially exit at better prices. As you get filled and control you break even price and net position with PSI Average Price the script will close the positions from oldest to newest. It also prints valuable information in the Expert tab about the overall position before and after the script. You can chose to cancel automatically any
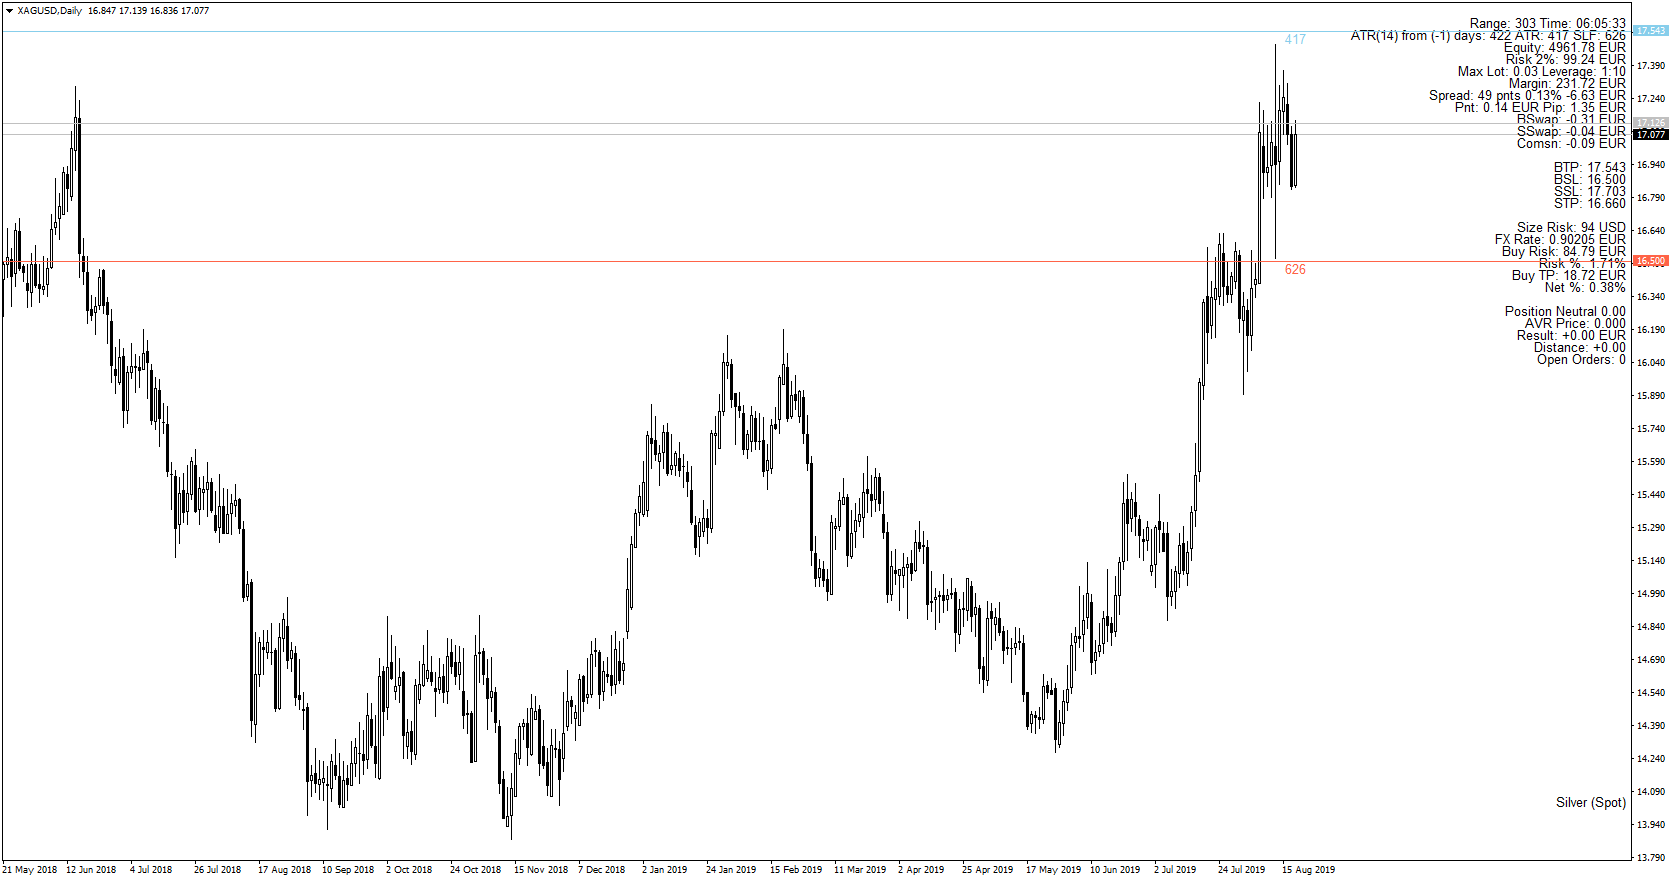
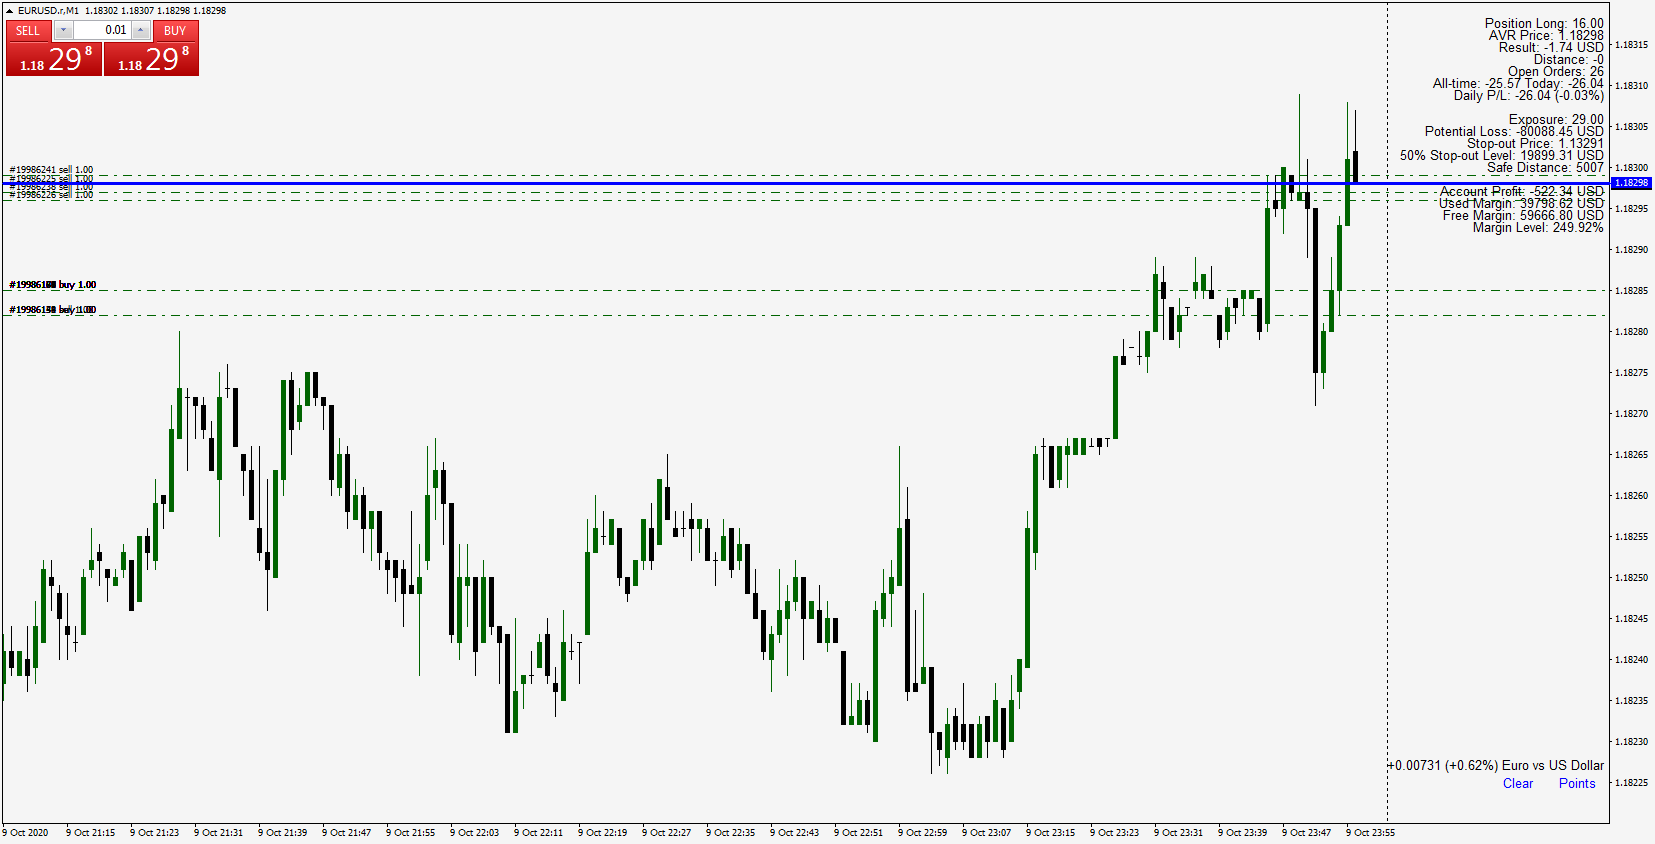
PSI AVR Price plots the Average Price, the Stop-Out level, Result, Account Information, Exposure Limits and much more like:
- You can add daily result to the Average Price or All-time results and even manual profit or loss from other account to reflect the Break Even Level you are interested in;
- Manual commentaries or Symbol description with the daily change;
- Buttons, labels, full and light version, ATR in the Data Window and so on;
PSI SL/TP script (defaulted to points and Print MSG) adds preset Stop Loss or Take Profit levels on all naked positions with just one click. It is easier then to modify and drag the levels with the One Click Trading. Additional settings and warnings especially if you put too tight Stop Loss in comparison to the spread. Check out also the Position Smart Indicator - a powerful Money Management tool (and much more) both useful for Price Action and Algo traders . NEW check the
New buttons for the highlighting of the sessions and ability to highlight specific day of week. Example last few Friday sessions.

Among them auto map major Highs and Lows for the past and current month and week. Grid line on common institutional levels Zero, 50 plus 20 and 80 level. New York Open Price (price during Midnight hour of NY Time) and Potential 33 pip target for a London High on Bearish Bias Day or vice versa.
As well as Manual Stop Loss, Take Profit targets and Manual Entry price for Money Management simulation on the outcome.
Added Clear Button to clear the Chart from manually drawn objects (or by changing the time frame). In order to keep your objects rename them (maybe just add some prefix).
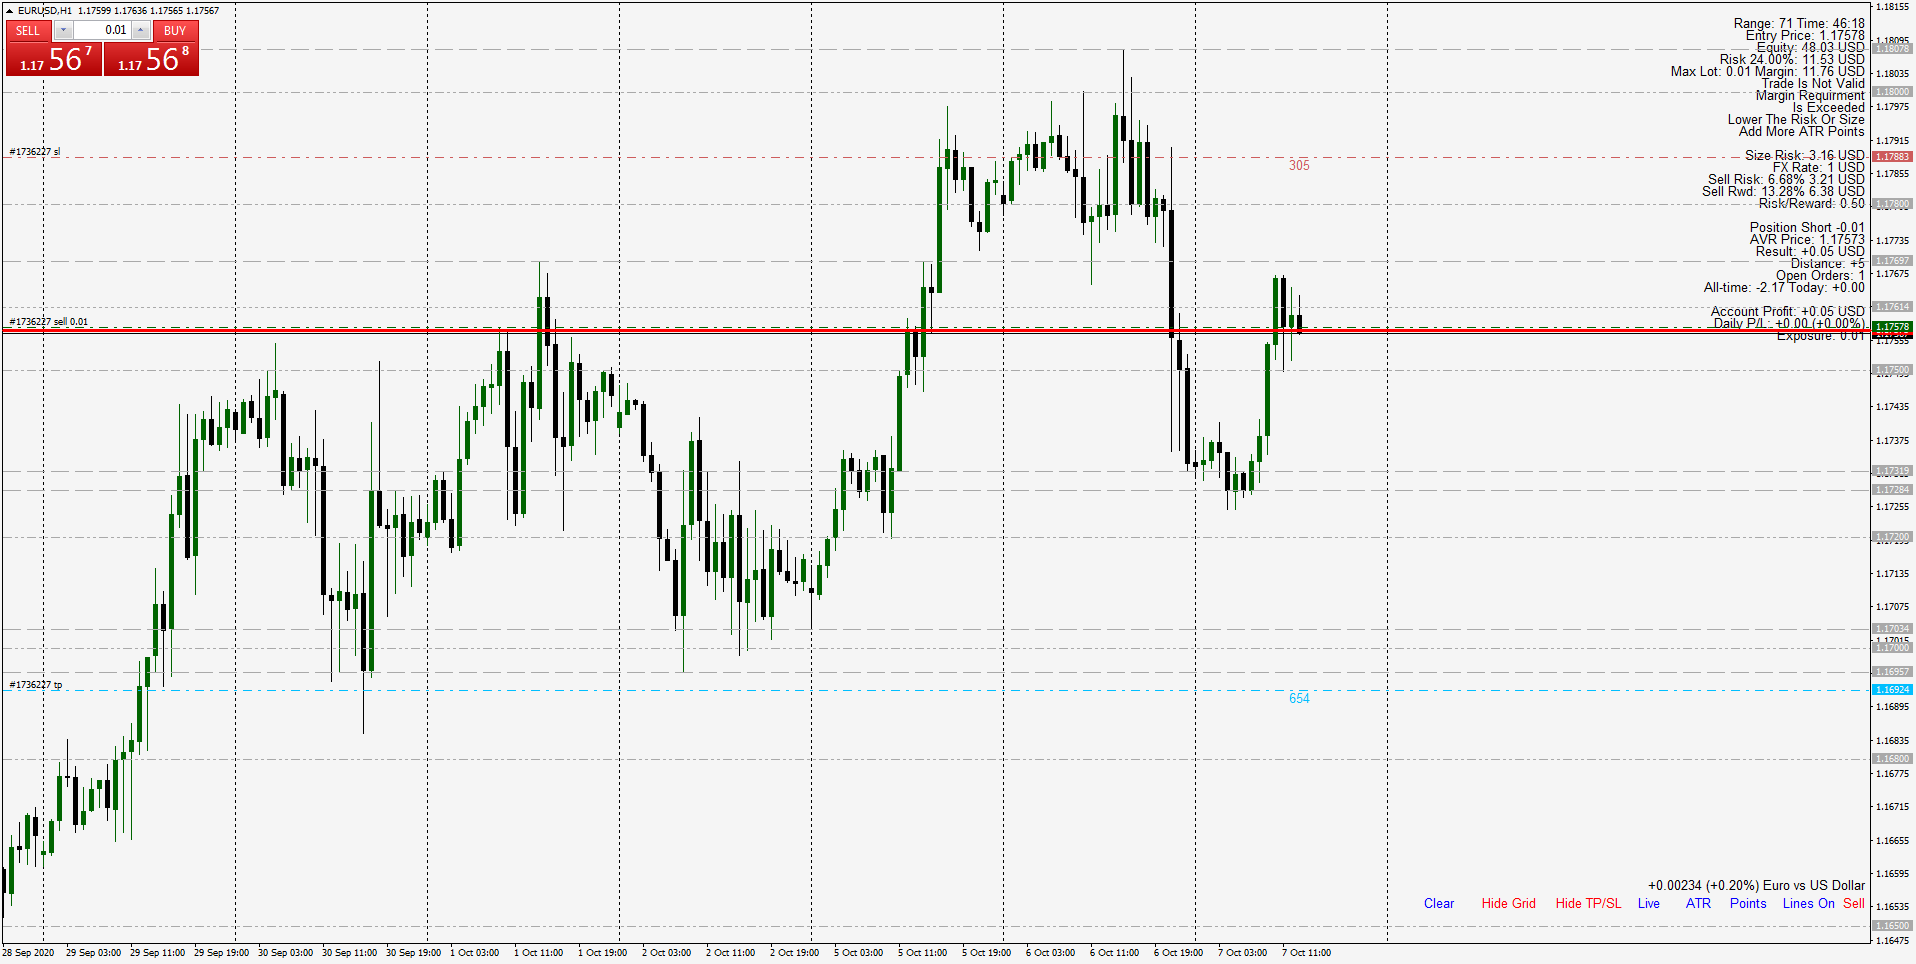
PSI SL/TP script adds preset Stop Loss or Take Profit levels on all naked positions with just one click. It is easier then to modify and drag the levels with the One Click Trading. Additional settings and warnings especially if you put too tight Stop Loss in comparison to the spread. Check out also the Position Smart Indicator - a powerful Money Management tool (and much more) both useful for Price Action and Algo traders . NEW check the FULL Version Including the private ICT
Among them warnings if Margin Requirements are exceeded or when preset Margin Level is Reach for new position. This means the Risk should be lower to lower the Position Size. Either by lowering the Risk or manually prefer lower ATR.
Also there is a warning if a traded based on the last closed price already hit stop loss or take profit is not valid.
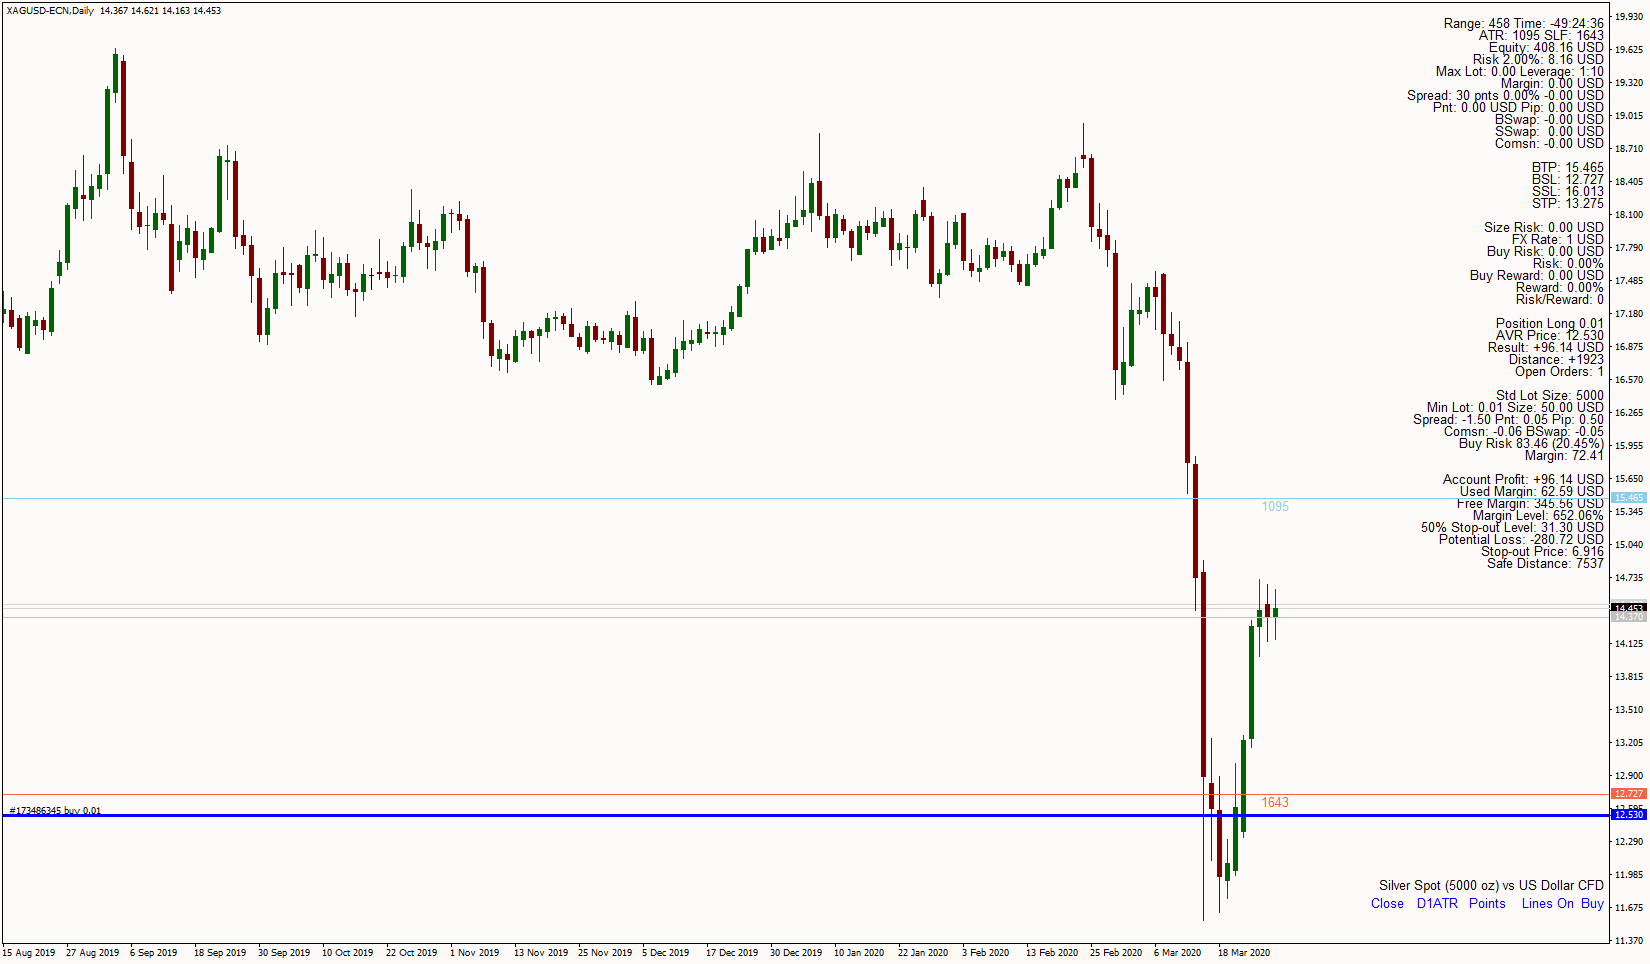
Added new button for ATR Stop Loss and Take Profits calculated based on the Live Prices or much better on the last candle Closed price.
Close means that the referential price for entry is the last candle close. This gives advantage to enter in much better risk to reward ratios (if you delay your entry for some reason) and the targets are calculated on the time of the signal. This is due to the fact the majority of indicator signals or price action patterns are confirmed only after the candle is closed not during its shaping.
If you are much closer to the candle's closing (something you can also check in the indicator under in the candle remaining time) you may switch to Live prices as they will be much more closer to the next referential price as the previous one could be already way off.


This is a simple but effective Forex trading algorithm.
Strong points of this algorithm:
- Ability to take stronger or earlier signals;
- Ability to quickly exit losing trades;
- 2 confirmation filters to reduce weak signals;
- Identifies take profit or compounding opportunities;
- Excellent for trailing stop and break even stop management;
- Excellent to test your Money Management skills;
- Excellent to test your charting abilities to identify trend and avoid consolidation;
- Excellent to test your ability to utilize volume confirmation indicators;
- Excellent to learn how to behave and take full advantage during strong trends;
- Pairs with Flexible ATR indicator;
- Free and very flexible with lots of extras for best user experience;
- Right out the bat Take Profit and Stop Loss suggestions;
- Current Market Bias before the candle close and signal status is updated;
Weak points of this algorithm:
- Comes without volume confirmation;
- If not properly used can produce consecutive scrap trades during periods of low volume and range price action;
So, what you can do with it and what you should be using it for?
You should be using this algorithm for learning purposes only. PSI Algo is heavy on visualization so it will help you better understand the market and your psychology and how you react to it. Use it to test how you stand in avoiding consolidation and taking full advantage of strong and lasting trends. Test your Money Management skills. If you don’t have all those skills, you will not be able to take advantage of this algorithm (and anything else) and you should aim to improve yourself. If you already possess these skills chances are that you have acquired a successful strategy and you don’t need this. However, you can still use this to test new ideas – like new volume or exit indicators, etc.
Disclaimer:
PSI Algo is profitable if you have what it takes to be a successful trader and apply it in a system. If you don’t, even though you will get an adequate entry and exit signals, you will screw it up. So don’t rush it. Just test on Demo account to see how close you are to master those skills. Use higher time frames for better results. Your goal should be to learn and develop your system by aiming to:
- avoid consolidations;
- identify trends;
- avoid weak low volume markets especially during Asian session;
- set proper risk (MM);
- learn managing your trades – trailing stop, exit, scale out and take profit, even compounding;
With all these in mind aim at least to be break-even (on Demo) and if you can you are going into the right direction where you can try to develop your own style and a complete system. Naturally by adding more pieces to the puzzle – like applying confirmation patterns, indicators, etc.
So DO NOT TRADE ON REAL, especially if you don’t have any successful trading experience with PROPER Money Management. If you don’t understand what is said here, DO NOT TRADE ON REAL BUT TRY TO LEAR ON DEMO! This is not a magical indicator that will replace a good trader, but will help you getting closer to be one.
Despite all of that’s been said here, if you still arrogantly of foolishly ignore the warnings and prerequisites to be successful and loose real money on Forex – it is not my fault. It is not because of me, or your broker, or the weather. It is because you are EXTREMELY stupid.
Read the Manual for better understanding of how to use PSI Algo in MT4 and read the signals.
Have fruitful learning experience.
Enjoy!
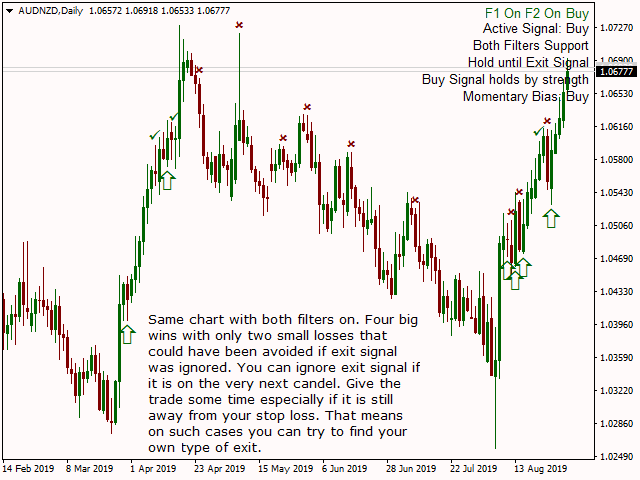
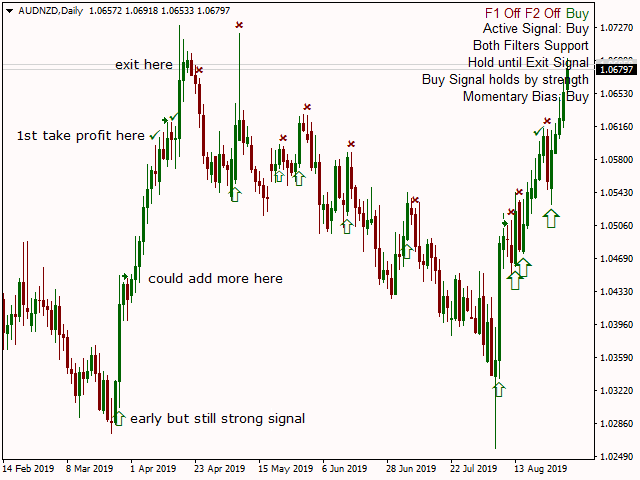
Main objects
- Chart symbols indicating different signals generated from the algorithm as well as the current information on the side with real time recommendations and commentaries;
- Buttons to switch between Sell and Buy preview and switching on and off Filters;
- Arrow Up symbol indicates a Buy signal;
- Arrow Down symbol indicates a Sell signal;
- The bigger the arrow the stronger the signal is as it can have Tier 1, Tier 2 or both Filters support;
- Tick means that the current signal is still valid but showing weakness (Tier 1 Filter disagrees with the entry). So, at this point taking profit or reducing the size of the trade and move the stop loss to break even for the remaining part is recommended;
- Pointing triangle means that on the last candle one or two of the filters previously in disagreement with the signal now confirm it. This could be used for compounding or as a continuation trade if you already closed your position on this signal. Shows on chart for non-selected filters.
- Cross means an opposite signal is activated. This should be used as an Exit signal for the current trade. Depending on the activated Filters not always and Exit will mean a valid opposite entry.
- By adding the Filters, you reduce the number of signals to only those which have more strength by multiple confirmations.
- By ignoring the Filters you can still use them for early exit or adding more to your position you even enter earlier (more aggressive style) in the market at better price.
- By examine the current Bias you can manage your position before the close. Note that the signals are generated only after the candle is closed. The current Bias is the picture in this moment as if the candle closes like this, but until it does it can change and reverse. That is why valid signals are only when a period of examination is ended.
- Filter 1 is excellent for avoiding trading against the trend or if there is not momentum. It also signals early take profit opportunities and even continuation trades on the active signal.
- Filter 2 gives more validity and overall strength to the signal. Very aggressively it can even be used to stay in a position even if a counter signal is activated. Given in mind if the Stop Loss, Money Management and your analysis allows it of course. Trading against this Filter is not wise decision especially in higher frames so if the algorithm already told you to close your position and Filter 2 is also not in your favor probably you should.
- Switch directly from the chart from Buy to Sell risk calculations.
- Show or hide Stop Loss and Take Profit Lines.
- Last but not least ability to switch from points to pips and vice versa.
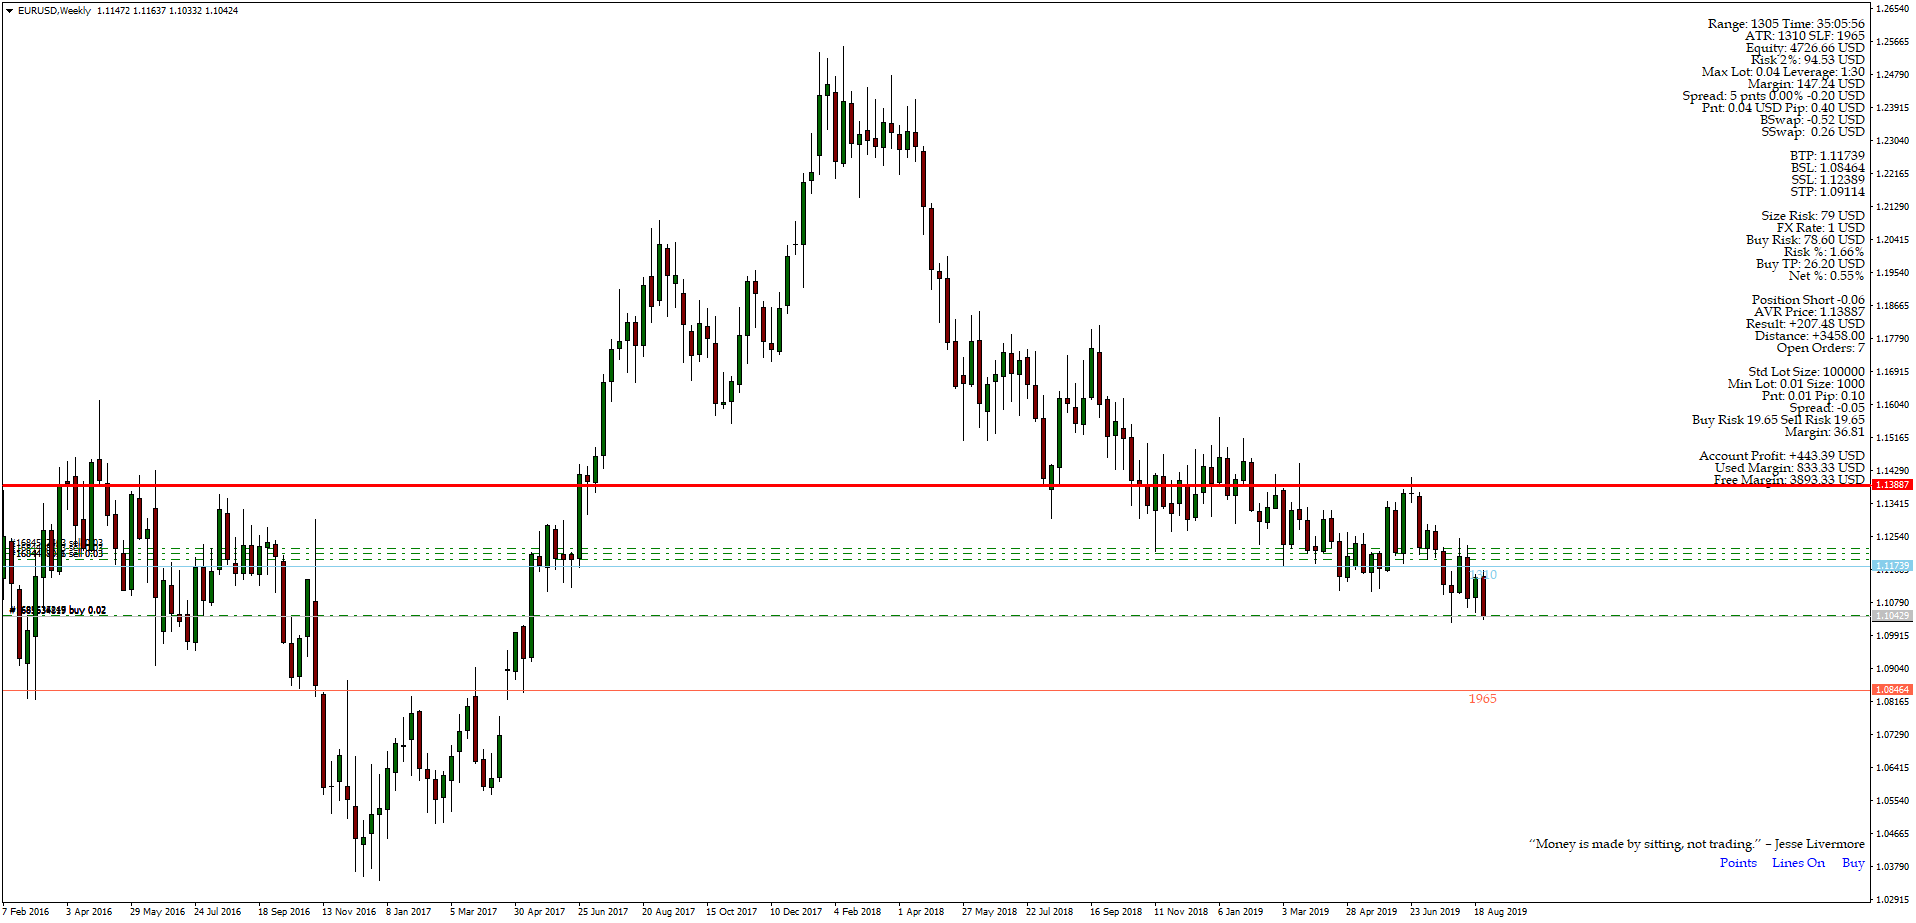
NEW check the FULL Version Including the private ICT tools limited so far until the release of the full 2016 Mentorship Core Content to the public. Indicator type: Money Management Calculator; Forex Position Size Calculator; Fixed or ATR value for Stop Loss and Take Profit levels; Average Position Size Indicator (True Average Price); Acc ount Information; Stop-out Level, Margin and Risk Exposure Warning, Forex Sessions; Institutional Levels Grid; Major Highs and Lows, Detailed Account
