Scalping Entry Points
- インディケータ
- Vitalyi Belyh
- バージョン: 1.20
- アップデート済み: 29 6月 2023
- アクティベーション: 8
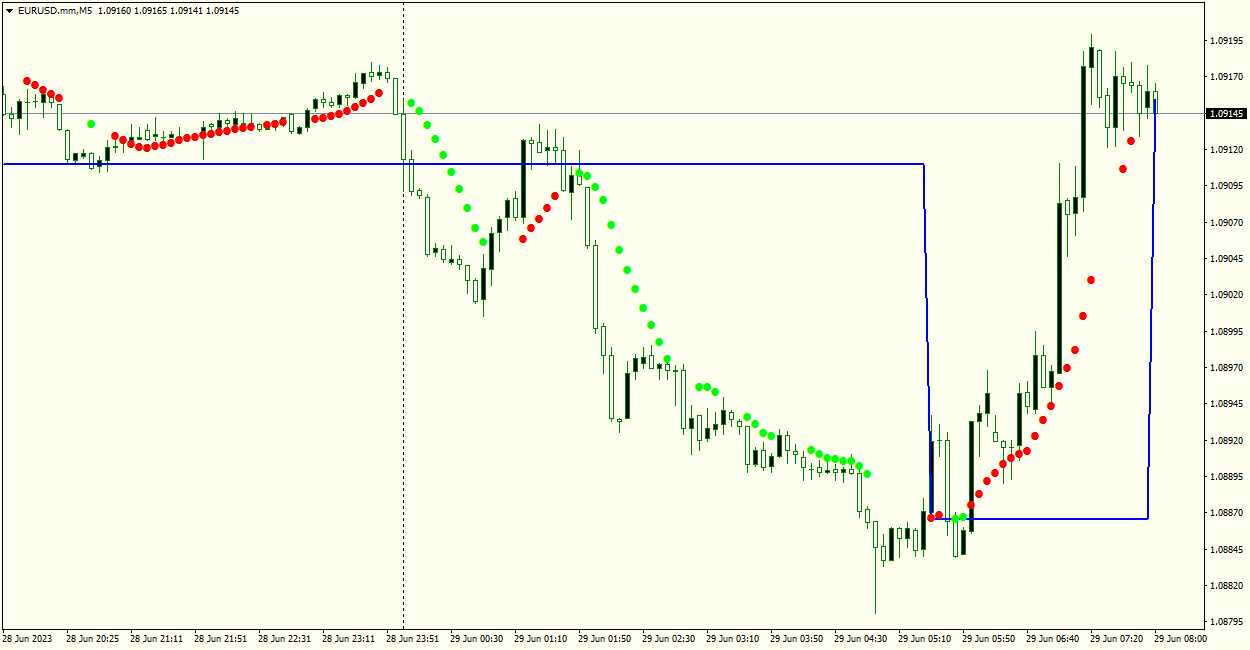
Scalping Entry Points - is a manual trading system that can adjust to price movements and give signals to open trades without redrawing. The indicator determines the direction of the trend by the central level of support and resistance. The dot indicator provides signals for entries and exits. Suitable for manual intraday trading, scalping and binary options. Works on all time frames and trading instruments.
The indicator gives several types of alerts.
How to use the product
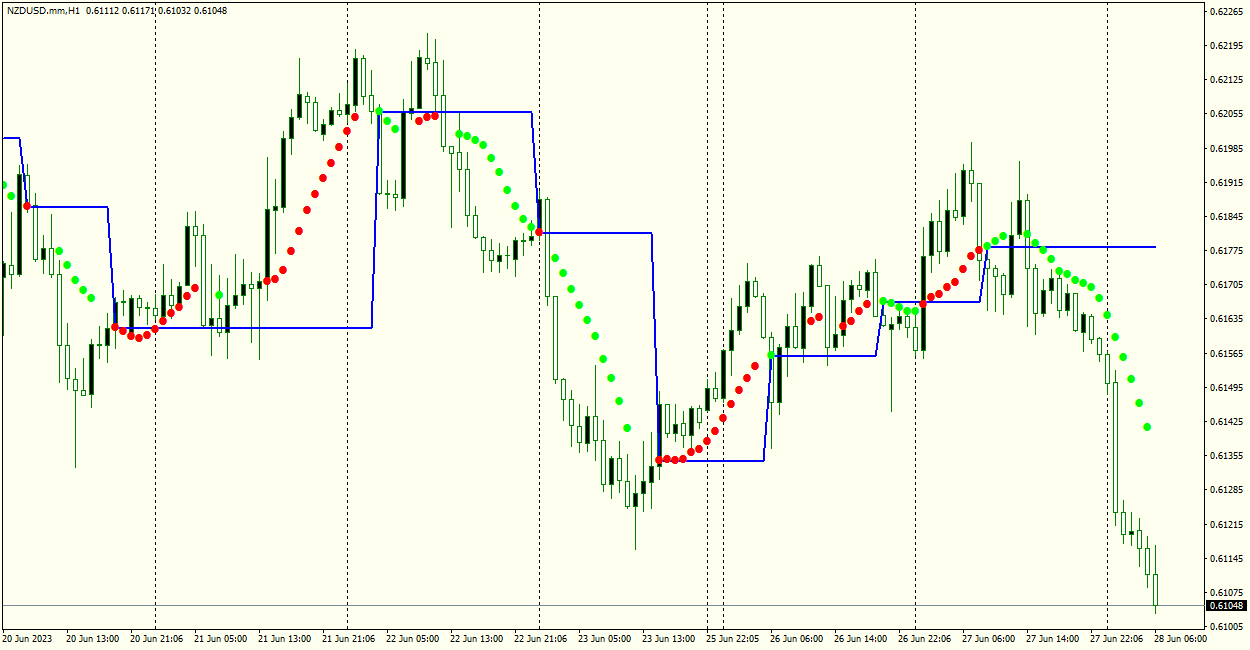
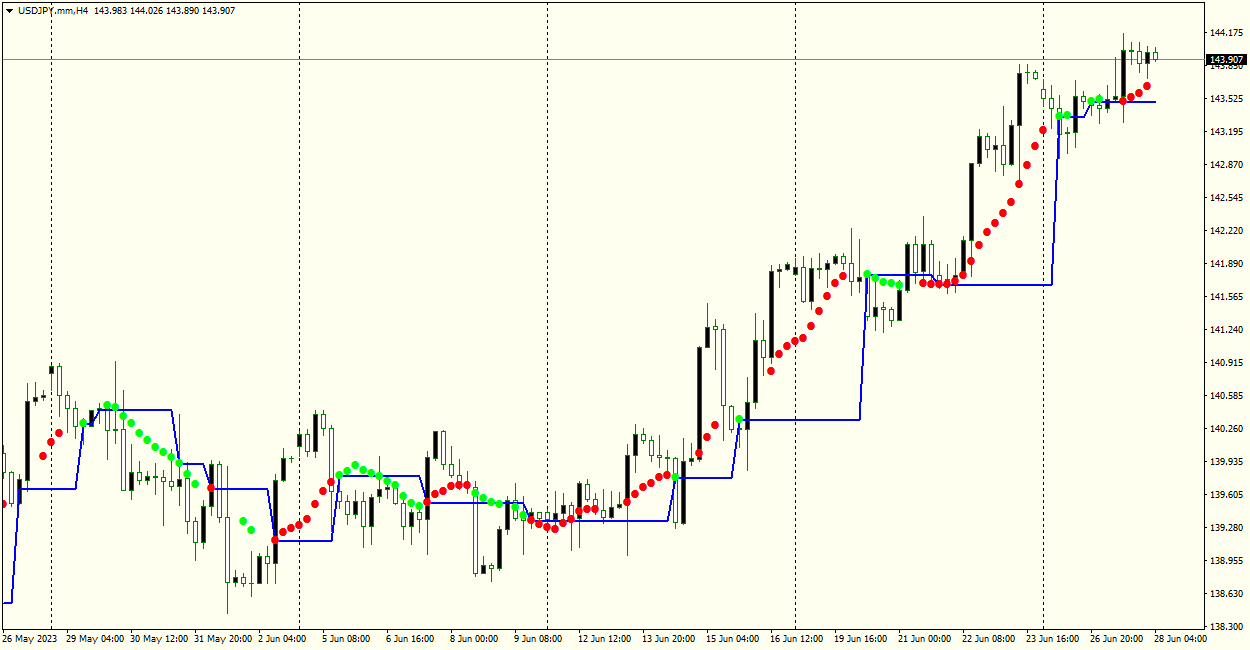
The blue line determines in which direction to make transactions relative to the average price level. If the price is above the level, we open long positions; if it is below, we open short positions.
Signals for openings are given by a dot indicator. Red dots - predicted upward price movement. Green dots - predicted downward price movement.
Change of points within the trend movement - the completion of the transaction.
The indicator has simple parameter settings.
"Entry Signal" determines how the input signal will be generated.
"Signal smoothness(1-9)" changes the smoothness of signals. Changes from 1 to 9 with increasing smoothness and signal length. It is recommended to increase if the Time Frames are small, and decrease if they are large.
"Trend Level" parameter changes the length of the central support and resistance level. If the parameter is larger, it can predict a longer trend length. Increase the parameter if the Timeframes are small, and decrease if they are large.
It is recommended to use on Time Frames from M5 and above.
Input parameters
The indicator gives several types of alerts.
How to use the product
The blue line determines in which direction to make transactions relative to the average price level. If the price is above the level, we open long positions; if it is below, we open short positions.
Signals for openings are given by a dot indicator. Red dots - predicted upward price movement. Green dots - predicted downward price movement.
Change of points within the trend movement - the completion of the transaction.
The indicator has simple parameter settings.
"Entry Signal" determines how the input signal will be generated.
"Signal smoothness(1-9)" changes the smoothness of signals. Changes from 1 to 9 with increasing smoothness and signal length. It is recommended to increase if the Time Frames are small, and decrease if they are large.
"Trend Level" parameter changes the length of the central support and resistance level. If the parameter is larger, it can predict a longer trend length. Increase the parameter if the Timeframes are small, and decrease if they are large.
It is recommended to use on Time Frames from M5 and above.
Input parameters
- Entry Signal - generates a signal at the close of the candle or during the drawing of the candle.
- Signal smoothness(1-9) - smoothness of signal points.
- Trend Level - the length of the trend level.
- Trend Only Signals - display trend only signals.
- Number Bars - The number of indicator bars on the chart.
- Play sound / Display pop-up message / Send push notification / Send email - Use alerts when signal points appear.
- Sound file signal - Sound file for the signal arrow.