バージョン 23.10
2023.12.16
- Extra currency remains visible when the Symbol is changed.
バージョン 23.9
2023.07.22
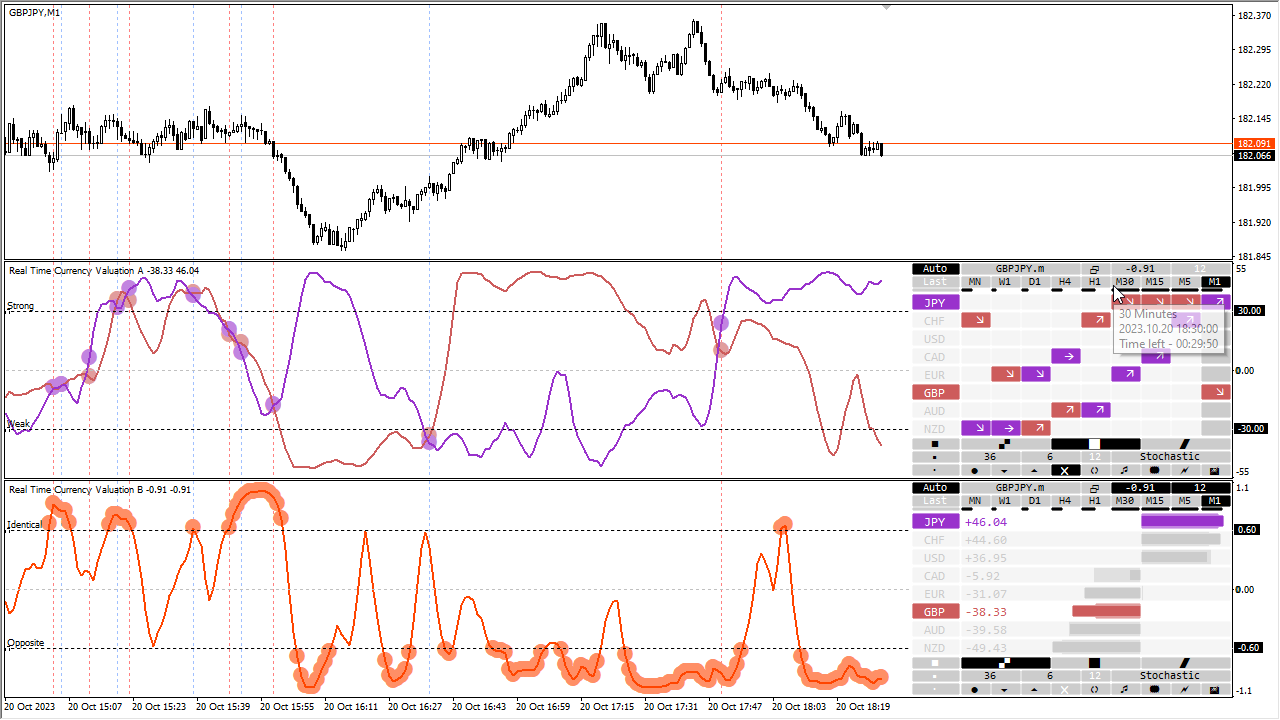
リアルタイムモードは別のストリームインジケーターに移動されました
バージョン 23.8
2023.04.29
コントロールパネル要素の構成の変更
ゼロバー上のイベントの表示を修正しました
バージョン 23.7
2023.04.20
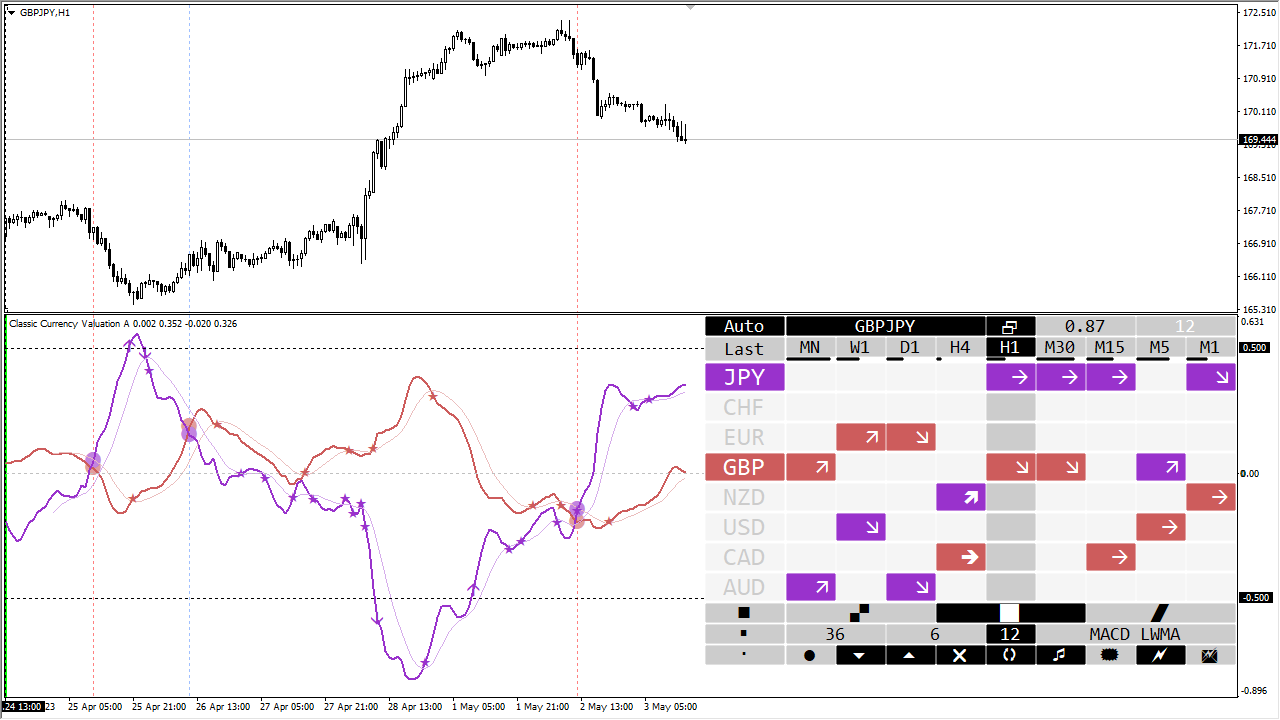
チャート上のクロスポイント-特別なモードを追加しました
最初はパネルがトリミングされ、自動シンボルがオンになっています
今アラートは、最初のバーに生成されます
最小限の修正と改善
バージョン 23.6
2023.04.14
更新してください
バージョン 23.5
2023.04.08
ベンドアラートを設定するためのカバレッジ期間を追加しました
マイナーな修正と改善
バージョン 23.4
2023.04.03
元の定義のインクリメント関数
通知の重大なバグを修正しました
グローバル変数のエントリを更新しました
アルゴリズムの最適化された部分
バージョン 23.3
2023.03.31
ゼロ色が自動モードで表示されるようになりました
ベンドアラートモードが利用可能になりました
市場マップのための新しいポインタ
さまざまな改善と修正
バージョン 21.112
2021.11.22
今、ヒストグラムと市場マップの種類は、その画像の任意の点をクリックすることによって切り替えられます
パネル操作のマイナーな修正
バージョン 21.111
2021.11.15
ソートせずに作られたが、色のグラデーションであるヒストグラムと市場マップの新しい種類を追加しました
新しいタイプの通知が開発されています
バージョン 21.102
2021.10.30
アラートシステムの入力パラメータの変更
バー内の歴史の固定深さを追加しました
パネルデザインのマイナーな修正
バージョン 21.101
2021.10.15
新しいデフォルトのサウンド
マイナーな修正
バージョン 21.81
2021.08.20
マイナーな修正
バージョン 21.71
2021.07.22
- Improved information content of the Histogram.
- Various improvements and fixes.
バージョン 21.62
2021.06.20
Updated the Market Map.
バージョン 21.61
2021.06.10
The "Market Map" has changed - the letter symbols have been replaced with intuitive arrow symbols.
バージョン 21.21
2021.02.28
- Increased the number of size options for the control panel
- A visual selection of a group of currency pairs has been added to the Symbol List tab
バージョン 21.12
2021.01.31
- Zero level is visible for all functions
- Strong and Weak levels is available for only Stochastic
バージョン 21.11
2021.01.20
- Added color settings for the tab "List Symbols"
- Color of the symbols changes dynamically
- Minor improvements
バージョン 20.121
2020.12.12
- Made minor corrections
バージョン 20.120
2020.12.02
- You can crop the control panel to the minimum size
- You can force the control panel to be placed on the left side
バージョン 20.112
2020.11.20
- Correction of inaccuracies
バージョン 20.111
2020.11.11
- Correction of mistakes
バージョン 20.110
2020.11.01
- Made minor corrections
バージョン 20.109
2020.10.30
- Added flip function for TF buttons
- Code optimization performed
- Various improvements
バージョン 20.108
2020.10.18
- Returned the fixed size option for Indication Panel
- New abbreviations for the market map:
P - transition to the Positive area through the Zero level.
N - transition to the Negative area through the Zero level.
バージョン 20.107
2020.10.17
- Fixed marking of Cross on Market Map
- Indication Panel has a Universal size
- Various improvements
バージョン 20.105
2020.10.09
Upgrade Market Map - display cross points
Transcript of letter abbreviations:
S | Strong, W | Weak - zones Strong and Weak currency
B | Bottom, T | Top - intersection Bottom or Top line
R | Rise, F | Fall - intersection Zero line
バージョン 20.100
2020.10.01
- Already close to perfection
バージョン 20.99
2020.09.28
- Bug fixes and improvements
バージョン 20.95
2020.09.21
- Added an indication of checking historical data
- Optimized Market Map calculation
- Various improvements and fixes
バージョン 20.90
2020.09.02
- "Extra brain" will be activated soon
- Fixed bugs
バージョン 20.80
2020.08.31
- Chart window will be on top after sound notification
- Changed indicator buffers to arrows rise and fall
- Cross points are highlighted in wide color lines
- Sorting symbols by correlation coefficient
- Various improvements and fixes
バージョン 20.78
2020.07.30
- Alert bug fixed
バージョン 20.7
2020.07.30
- Up to 28 symbols can be used in calculations
- Up to 36 symbols in the list sorted by growth
- The market map covers all timeframes
- No delay when changing charts
- Various improvements and fixes
バージョン 20.6
2020.07.15
Improvements and bug fixes
バージョン 20.5
2020.05.27
Preview release
バージョン 18.8
2018.08.16
- enhance history auto upload reliability during the indicator's first launch
- new control buttons added to the display panel
- will be added the market map of coming soon
バージョン 18.1
2018.01.16
- the font is automatically adjusted depending on the specified Windows scale
- minor fixes and improvements
バージョン 17.12
2017.12.20
- added zero level crossing signals and email notifications
- added appropriate buttons to the panel, as well as timeframe switch buttons
- improved history auto upload reliability during the indicator's first launch
- only the symbols present in the Market Watch are included to the hot list
- history depth is now automatically adjusted to the chart width
- added the button for selecting the best pair with the major currency
バージョン 17.8
2017.08.01
- doubled color settings on the indication panel
- added the parameter for auto-regulating notification levels
- fixed errors on a new chart
バージョン 17.7
2017.07.06
- the Hot List of currency pairs can be displayed on the indication panel
- added signals about intersections with placing labels on history
- notification levels are available for the correlation coefficient
- added new controls to the indication panel:
1. Button to select the previous symbol
2. Buttons to control the notification system
3. Buttons to control the notification modes
- added new input parameters:
1. Alert Mode - select the notification mode (Levels of Crossovers)
2. Alert Top Level - value of the upper level
3. Alert Bottom Level - value of the lower level
- when the "Chart Shift" button is released, the indication panel is located on the left side
- the color scheme of the indicator adjusts to the terminal's color "on the fly"
バージョン 17.4
2017.04.21
- new compact control panel with the ability of fast switching between the currency pairs.
- a new chart of any currency pair can opened directly from the control panel
- all visual settings are stored when switching between symbols or chart timeframes
- extended the notification settings, and the intersection points are displayed directly in the indicator window
- the number of input parameters has been reduces for ease of use
- fixed minor bugs and performed optimization of the algorithms
バージョン 16.31
2016.03.23
- added the horizontal histogram to the indication panel.
- the tenfold ratio for all periods is activated in real time mode.
バージョン 16.12
2016.01.26
- minor visual improvements.
バージョン 16.11
2016.01.19
- The panel size can be increased 1.5 or 2 times.
- Unnecessary lines can be hidden, leaving only the current ones on the chart.
- Controls on the panel can be hidden.
バージョン 15.101
2015.10.02
- Push notifications are available in real time.
- Labels denoting crossing points are added to a chart when setting notification lines.
バージョン 15.91
2015.09.14
- Added an option for showing/hiding lines on the control panel.
- Added an option for removing the alerting system from the control panel.
- Fixed bug with multiple alert triggering.
- Added Push notification.
- Algorithms have been optimized.
バージョン 15.81
2015.08.05
- changed the control and indication panel.
バージョン 15.73
2015.07.21
- added ability to select an averaging method for MA, MACD and CCI.
- added ability to work with CFD.
バージョン 15.72
2015.07.09
- added ability to save parameters set via the control panel when changing the period of the chart or the symbol.
- you can hide the control and indication panel.
バージョン 15.71
2015.07.01
- added the interactive panel allowing you to change parameters of built-in indicators on the fly.
- added the rating table with signal indication.
- added Spearman's rank correlation coefficient calculation.
バージョン 15.62
2015.06.17
- improved operation in the Strategy Tester.
- improved an error occurred when there is a lack of historical data.
- notification levels are moved from the edge.


I like it. Many uses. The Developer Igor, is friendly and helpful.