• 概要
  • レビュー
  • コメント

Trade Position Sizer

The indicator has been designed to function on any time-frame and any pair.


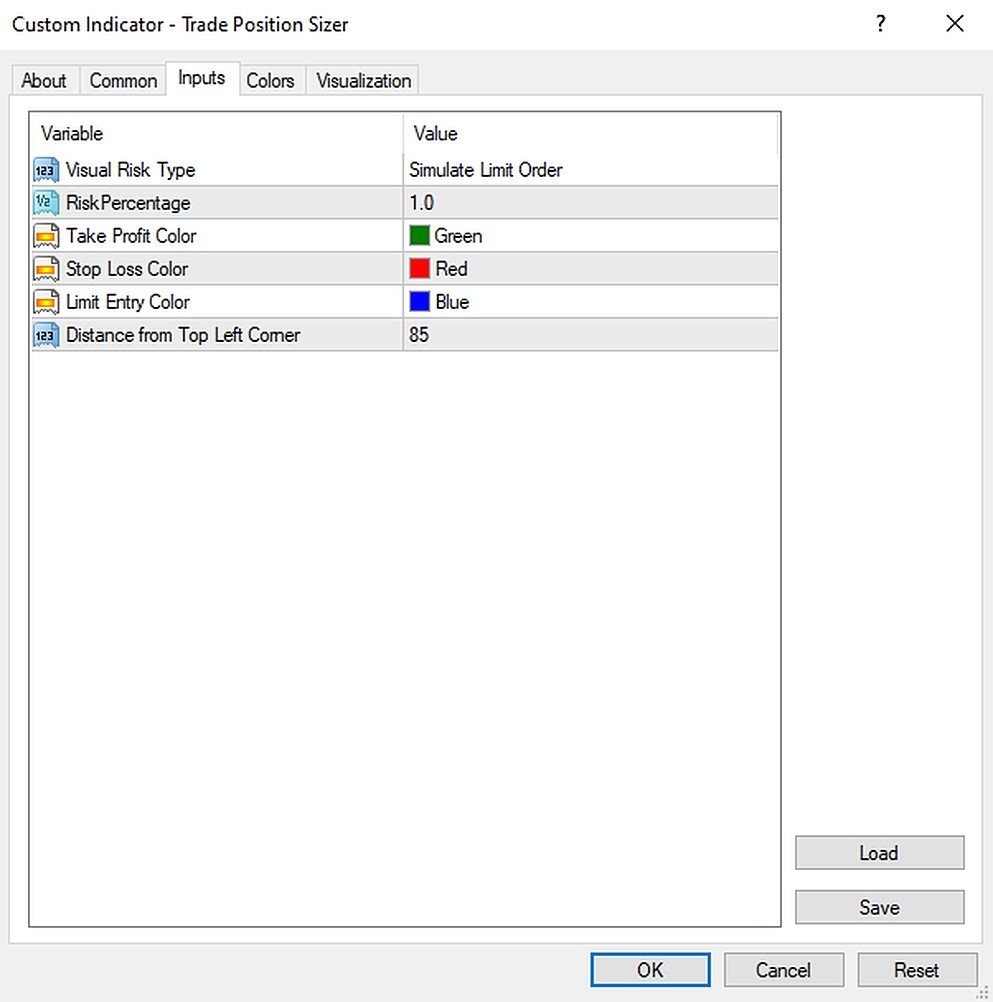
The user is able to input their desired risk percentage per trade based on their account size, and choose whether they wish to calculate risk based on a limit order or market order.


When initialised, a non-invasive button will appear on the left-hand side of the chart. Upon selection, a drop down will appear with a Buy and Sell button, these will in turn place movable lines on the chart that are used to appropriately size the trade. All the calculated information is displayed on the chart, as well as the profit and loss targets using the horizontal lines.


If wanting to use a different risk percentage, the trader will be required to reinitialise the indicator using the terminal’s indicator list.

おすすめのプロダクト
Pin Bars
Yury Emeliyanov
5 (3)
主な目的:"ピンバー"は、自動的に金融市場チャート上のピンバーを検出するように設計されています。 ピンバーは、特徴的なボディと長いテールを持つキャンドルであり、トレンドの反転または修正を知らせることができます。 それがどのように機能するか:インジケーターはチャート上の各キャンドルを分析し、キャンドルの体、尾、鼻のサイズを決定します。 事前定義されたパラメータに対応するピンバーが検出されると、インジケータはピンバーの方向(強気または弱気)に応じて、上矢印または下矢印でチャート上に パラメータ: TailToBodyRatio-テールの長さとピンバーのボディサイズの最小比率を定義します。 NoseToTailRatio-ピンバーの「ノーズ」とテールの間の最大許容比を設定します。 ArrowSize-マークされたピンバーとチャート上のピンバーを指す矢印との間の距離を定義します。 適用:"ピン棒"の表示器が潜在的な傾向の逆転ポイントを識別し、市場か近い位置を書き入れる信号を発生させるのに使用することができます。 正しく使用され、他のテクニカル指標や分析方法と組み合わせると、指標は取引
FREE
This indicator has been created for finding the probable reversal points of the symbol price. A small candlestick reversal pattern is used it its operation in conjunction with a filter of extremums. The indicator is not redrawn! If the extremum filter is disabled, the indicator shows all points that have a pattern. If the extremum filter is enabled, the condition works – if the history Previous bars 1 candles back contains higher candles and they are farther than the Previous bars 2 candle, such
FREE
Scalping indicator. It takes into account volatility, price movement in the local interval and the direction of the current trend. Recommended timeframe - M5. Advantages: Low volatility when a signal appears ensures minimal movement against an open position. The indicator does not redraw its signals. There are alert signals. It is a great tool for day trading. Settings: Name Description Period Indicator period Range of each bar in the period (pp.) The maximum size of each candle in the indicat
FREE
Shape Pack
John Louis Fernando Diamante
This indicator provides common shapes as drawing object options. The shapes are rotatable, resizable, draggable, and will keep their proportions (according to their handle trendline) across different chart scales. Multiple drawings are supported. Shapes: Square Rhombus Triangle (quadrilateral & isosceles) Circle (grid, overlapped grid, flexi grid, rotatable grid, concentric circles) Features: rays (all object edges will be rays) show/hide each individual drawing type, or all delete last drawn
FREE
QuantumAlert Stoch Navigator is a free indicator available for MT4/MT5 platforms, its work is to provide "alerts" when the market is inside "overbought and oversold" regions in the form of "buy or sell" signals. This indicator comes with many customization options mentioned in the parameter section below, user can customise these parameters as needful. Join our   MQL5 group , where we share important news and updates. You are also welcome to join our private channel as well, contact me for the p
FREE
Are you tired of drawing trendlines every time you're analyzing charts? Or perhaps you would like more consistency in your technical analysis. Then this is for you. This indicator will draw trend lines automatically when dropped on a chart. How it works Works similar to standard deviation channel found on mt4 and mt5. It has 2 parameters: 1. Starting Bar 2. Number of bars for calculation The   starting bar   is the bar which drawing of the trend lines will begin, while the   number of bars for c
FREE
TrendPlus
Sivakumar Subbaiya
4.08 (12)
Trend Plus   Trendplus  Indicator   Time Frame: Suitable for any time frame.  Purpose: Trend Prediction. Blue and red candle indicate the buy and sell call respectively. Buy: When the blue candle is formed buy call is initiated. close the buy trades when the next red candle will formed.   Sell: When the Red candle is formed Sell call is initiated. close the Sell trades when the next blue candle will formed.   Happy trade!!
FREE
Free informative Indicator-helper. It'll be usefull for traders who trade many symbols or using grid systems (Averaging or Martingale). Indicator counts drawdown as percent and currency separate. It has a number of settings: Count deposite drawdown according equity value and send e-mail or notifications to user if DD more than set; Sending e-mail when max open orders reached; Shows price and remaining pips amount before MarginCall on current chart and Account generally; Display summary trade lot
FREE
This indicator alerts you when/before new 1 or 5 minute bar candle formed. In other words,this indicator alerts you every 1/5 minutes. This indicator is especially useful for traders who trade when new bars formed. *This indicator don't work propery in strategy tester.Use this in live trading to check functionality. There is more powerful Pro version .In Pro version,you can choose more timeframe and so on. Input Parameters Alert_Or_Sound =Sound ----- Choose alert or sound or both to not
FREE
MASi Three Screens is based on the trading strategy by Dr. Alexander Elder. This indicator is a collection of algorithms. Algorithms are based on the analysis of charts of several timeframes. You can apply any of the provided algorithms. List of versions of algorithms:     ThreeScreens v1.0 - A simple implementation, with analysis of the MACD line;     ThreeScreens v1.1 - A simple implementation, with analysis of the MACD histogram;     ThreeScreens v1.2 - Combines the first two algorithms
FREE
Candle GAP
Thushara Dissanayake
3 (1)
ローソク足ギャップ インジケーターは、曜日ごとのローソク足ギャップを自動的に識別するため、 ギャップ取引戦略を 利用するトレーダーにとって不可欠なツールです。ギャップとは、連続する 2 日間の終値と始値の間の価格レベルの差を指します。このインジケーターは、共通、離脱、継続、枯渇の 4 種類のギャップ パターンを認識します。このインジケーターをチャートに組み込むことで、トレーダーはシグナルを検証し、取引の意思決定を強化できます。 ローソク足 GAP インジケーターの重要な特徴の 1 つは、D1 (日次) の下の任意の時間枠および任意のシンボルまたは商品に対して使用できる多用途性です。使いやすいパラメータを提供し、あらゆる経験レベルのトレーダーが利用できるようになります。このインジケーターはチャート上にギャップ パターンを迅速に描画し、迅速な分析と意思決定を可能にします。そのシンプルさにより使いやすさが向上し、簡単で効率的な取引体験が保証されます。 インジケーターのデータ表示パラメーターを使用すると、トレーダーはギャップ情報の外観をカスタマイズできます。ユーザーは、各曜日に関連付けられたテ
FREE
このインジケーターは、アクティブおよび非アクティブな取引セッションを表示し、取引セッションがアクティブ (1) または非アクティブ (0) であるかどうかとしてグローバル変数を設定します。 iCustom ライブラリ関数を使用すると、次のように Expert Advisor またはスクリプトからこの指標を呼び出すことができます。 // カスタム インジケーターを呼び出す iCustom ( Symbol (), PERIOD_D1 , "Market/RedeeCash_TimeZone" , 0 , 0 ,Blue,Red); // グローバル変数の値を取得する double NewYorkSessionIsActive = GlobalVariableGet ( "TZ-NewYork" ); double LondonSessionIsActive = GlobalVariableGet ( "TZ-London" ); double SydneySessionIsActive = GlobalVariableGet ( "TZ-Sydney" ); double TokyoSe
FREE
Free automatic Fibonacci is an indicator that automatically plots a Fibonacci retracement based on the number of bars you select on the BarsToScan setting in the indicator. The Fibonacci is automatically updated in real time as new highest and lowest values appears amongst the selected bars. You can select which level values to be displayed in the indicator settings. You can also select the color of the levels thus enabling the trader to be able to attach the indicator several times with differe
FREE
The indicator displays signals according to the strategy of Bill Williams on the chart. Demo version of the indicator has the same features as the paid, except that it can work only on a demo account . Signal "First Wise Man" is formed when there is a divergent bar with angulation.  Bullish divergent bar - with lower minimum and closing price in the upper half. Bearish divergent bar - higher maximum and the closing price at the bottom half. Angulation is formed when all three lines of Alligat
FREE
MACD indicator in MetaTrader 4/5 looks different than MACD does in most other charting software. That is because the MetaTrader 4/5 version of MACD displays the MACD line as a histogram when it is traditionally displayed as a line. Additionally, the MetaTrader 4/5 version computes the Signal line using an SMA, while according to MACD definition it is supposed to be an EMA. The MetaTrader 4/5 version also does not compute a true MACD Histogram (the difference between the MACD/Signal lines). This
FREE
QuantumAlert RSI Navigator is a free indicator available for MT4/MT5 platforms, its work is to provide "alerts" when the market is inside "overbought and oversold" regions in the form of "buy or sell" signals. This indicator comes with many customization options mentioned in the parameter section below, user can customise these parameters as needful. Join our   MQL5 group , where we share important news and updates. You are also welcome to join our private channel as well, contact me for the pri
FREE
MegaTrends
Sivakumar Subbaiya
1 (1)
Megatrends  Indicator   Time Frame: Suitable for any time frame.  Purpose: Trend Prediction. Blue and red color indicate the buy and sell call respectively. Buy: When the blue line is originating it is opened buy call. Sell: When the Red line is origination it is opened sell call Happy trade!! this indicator is suitable for all time frame, but our recommended time frame to use 1hour and 4 hours, suitable for any chart.
FREE
Market Structure Zig Zag
Lesedi Oliver Seilane
4.65 (26)
Free Market structure zig zag to assist in price action trading the screenshots describe how to use and how to spot patterns new version comes with alerts, email alert and  push notification alert can be used on all pairs  can be used on all timeframes  you can add additional confirmation indicators the indicator shows you your higher high and low highs as well as your lower lows and lower highs  the indication makes price action analysis easier to spot.
FREE
In FX, signals from doji patterns can be effective in capturing potential trend developments. Therefore, setting pending orders simultaneously after the appearance of a doji can make it easier to capture the onset of a trend. Setting stop-loss (SL) and take-profit (TP) levels more widely can enhance the probability of success, but it also increases the associated risk. In the event of a loss, it is possible to recover by increasing the next position size through multi-lot trading, but this
FREE
--->  Check all the other products  <--- The Candle Bias is a coloring indicator that doesn't take account of the close price of the bars.  It will color the candle in the bearish color (of your choice) if the downard range is greater than the upward range.  Conversely, it will color the candle in the bullish color of your choice if the upward range is greater than the downward range.  This is a major helper for Multi Time Frame analysis, it works on every security and every Time Frame. You
FREE
The indicator displays overbought and oversold levels, calculating them using the Fibonacci golden ratio formula. It enables both trend-following and counter-trend trading, accommodating breakouts and rebounds from these levels. It operates on all timeframes, across various currency pairs, metals, and cryptocurrencies. Suitable for binary options trading. Key Features:  Based on the Fibonacci golden ratio  Shows overbought and oversold levels  Suitable for market and pending orders  Sim
FREE
The indicator builds a Renko chart in the sub window for the current symbol. The bars are formed from live data and the desired bar size can be set in the inputs tab. Most importantly, because the Renko chart only uses price to construct bars and ignores time, the indicator can be applied to any time frame and same results can be achieved. Recommended usage As Renko charts are famous for eliminating noise so traders can use this tool to see clear picture of the trend to help their analysis, ent
FREE
MQLTA Support Resistance Lines is an indicator that calculates the historical levels of Support and Resistance and display them as Lines on chart. It will also Alert you if the price is in a Safe or Dangerous zone to trade and show you the distance to the next level. The indicator is ideal to be used in other Expert Advisor through the iCustom function. This DEMO only works with AUDNZD, the full product can be found at https://www.mql5.com/en/market/product/26328 How does it work? The indicato
FREE
This indicator is a perfect tool able to compare which brokers have the lower latency. It shows us immediately which brokers are slower or faster. When you see the dot icon on the line, it means this broker is the faster one and the red line (Broker_A) is the slower one. See the example on the screenshot. How It Works? This indicator shares the prices information to and from the "shared" common data folder. It compares all the prices. The price is based on average by (Ask + Bid) / 2. There are
FREE
Rainbow MT4 is a technical indicator based on Moving average with period 34 and very easy to use. When price crosses above MA and MA changes color to green, it’s a signal to buy. When price crosses below MA and MA changes color to red, it’s a signal to sell. The Expert advisor ( Rainbow EA MT4) based on Rainbow MT4 indicator, as you can see in the short video below is now available here .
FREE
Show Pips
Roman Podpora
4.3 (53)
この情報インジケーターは、アカウントの現在の状況を常に把握したい人にとって役立ちます。このインジケーターには、ポイント、パーセンテージ、通貨での利益、現在のペアのスプレッド、現在の時間枠でバーが閉じるまでの時間などのデータが表示されます。 バージョンMT5 -   より便利なインジケーター チャート上に情報線を配置するには、いくつかのオプションがあります。 価格の右側 (価格の後ろにあります); コメントとして (グラフの左上隅に); 画面の選択した隅。 情報区切り記号を選択することもできます。 | / 。 \ # インジケーターにはホットキーが組み込まれています。 キー 1 - 情報表示の種類に戻ります (価格、コメント、コーナーの右側) キー 2 - 情報表示の種類を 1 つ進みます。 キー 3 - 情報ライン表示の位置を変更します。 ホットキーは設定で再割り当てできます。 このインジケーターは使いやすく、非常に有益です。設定で不要な情報項目を無効にすることも可能です。 設定 表示された情報を置き換えるホット キー (戻る)   - 情報表示の種類に戻ります。 表示情報を切
FREE
FTUイディオテック このインジケーターはMT4プラットフォーム用で、単独で使用できますが、他のインジケーターや戦略と組み合わせるのが最適です。 macd、adxなどの様々なインジケーターを組み合わせて矢印を描き、エントリーやトレンド転換を示唆 YouTube で短い紹介ビデオをご覧ください: https://youtu.be/lCRJ3mFNyOQ インジケーターの特徴: 矢印の販売と購入 視覚と音による警告 トレンド継続 / 早期トレンド転換シグナル 新機能: 履歴内のバーの数を制限する バーから矢印までの距離を変更する 使用法: このインジケーターは、ほとんどの資産グループ、外国為替、商品、指数などで使用できます。 すべてのタイムフレーム、再描画なし、高速読み込み 私の FTU Predictor と組み合わせると、確実に優位性が得られます。 いくつかのアドバイス: 資金管理と規律が鍵であり、単一の戦略や指標が成功をもたらすことはありません。損失は発生するものであり、それをどのように回復するかを理解することが重要です。小さな勝ったり負けたりして、市場に恩返しすることがすべての日
FREE
Check my paid tools they work great and I share Ea's based on them for free please r ate The Dual Timeframe RSI (Relative Strength Index) indicator is a novel trading tool that allows traders to monitor RSI readings from two different timeframes on a single chart. This dual perspective enables traders to identify potential trend confirmations and divergences more effectively. For instance, a trader might use a 1-hour RSI alongside a daily RSI to ensure that short-term trades align with the bro
FREE
Wicks UpDown Target GJ Wicks UpDown Target GJ is specialized in GJ forex pairs. Choppy movement up and down on the opening range every day.  Trading breakouts on London session and New York session is recommended. Guideline Entry Strategy Idea: Step 1 - Breakout Forming (Warning! Trade on London Session and New York Session) Step 2 - Breakout Starting (Take Action on your trading plan) Step 3 - Partial Close your order & set breakeven (no-risk) Step 4 - Target complete Step 5 - Don't tr
FREE
The indicator displays signals according to the strategy of Bill Williams on a chart: 1. Signal "First Wise Man" is formed when there is a divergent bar with angulation. A bullish divergent bar has a lower minimum and the closing price in its upper half. A bearish divergent bar has a higher maximum and the closing price at the bottom half. Angulation is formed when all three lines of Alligator are intertwined, and the price has gone up significantly(or downwards). A valid bullish/bearish div
このプロダクトを購入した人は以下も購入しています
Gann Made Easy は、ミスター・ギャンの理論を使用した取引の最良の原則に基づいた、プロフェッショナルで使いやすい外国為替取引システムです。 W・D・ガン。このインジケーターは、ストップロスとテイクプロフィットレベルを含む正確な買いと売りのシグナルを提供します。 PUSH通知を利用して外出先でも取引可能です。 購入後はご連絡ください!私の取引のヒントと素晴らしいボーナスインジケーターを無料で共有します! おそらく、ギャンの取引手法についてはすでに何度も聞いたことがあるでしょう。通常、ギャンの理論は初心者のトレーダーだけでなく、すでにある程度の取引経験がある人にとっても非常に複雑なものです。なぜなら、ギャンの取引手法は理論的にはそれほど簡単に適用できるものではないからです。私はその知識を磨き、最良の原則を私の外国為替インジケーターに組み込むために数年を費やしました。 このインジケーターは非常に簡単に適用できます。必要なのは、それをチャートに添付し、簡単な取引推奨事項に従うだけです。このインジケーターは常に市場分析の仕事を行い、取引の機会を探します。適切なエントリーポイントを検出
まず第一に、この取引インジケーターは再描画されず、再描画されず、遅延しないことを強調する価値があります。これにより、手動取引とロボット取引の両方に理想的なものになります。 ユーザーマニュアル:設定、入力、戦略。 アトミックアナリストは、価格の強さとモメンタムを利用して市場でより良いエッジを見つけるためのPA価格アクションインジケーターです。ノイズや誤ったシグナルを除去し、取引ポテンシャルを高めるための高度なフィルターを備えています。複雑なインジケーターの複数のレイヤーを使用して、アトミックアナリストはチャートをスキャンし、複雑な数学的計算をシンプルなシグナルと色に変換します。これにより、どのような初心者トレーダーでも理解して使用し、一貫した取引の決定を行うことができます。 「アトミックアナリスト」は、新規および経験豊富なトレーダー向けにカスタマイズされた包括的な取引ソリューションです。プレミアムインジケーターとトップノッチの機能を1つの取引戦略に組み合わせ、すべてのタイプのトレーダーにとって汎用性のある選択肢にします。 デイリートレーディングとスキャルピング戦略:高
最初のパルスレベルを反転 (RFI)     指示する     ロシア     -        utilizar con   el indicador の ESP 推奨事項 -   TPSpro トレンド プロフェッショナル版 -   MT5のバージョン 最も重要なことは、将来においても最も重要なことです。 機能のプリンシパル: ゾーンのほとんどは、ベンダーとコンプラドールによってアクティブ化されます。 状況を直感的に把握できるよう、初期の衝動を修正します。 LOGIC AI: MUESTRA zonas (círculos) parabuscar puntos de entrada cuando se activa una plantilla 視覚的に優れた視覚効果があり、最も重要な機能がすべて揃っていることに注意してください。 優れたニベレス/ゾーンの視覚化 (modo MTF) 世界で最も人気のある場所/ゾーンです。これを使用するのに最適な方法です (   TPSproTREND PRO   )。 アルゴリズム プロフェッショナル セパラド パソ ア パソ パラ オペラ それは
Enigmera
Ivan Stefanov
5 (3)
エニグメラ:市場の中核 https://www.enigmera.com はじめに このインディケータと取引システムは、金融市場に対する驚くべきアプローチです。ENIGMERAは、フラクタルサイクルを使用して、サポートとレジスタンスレベルを正確に計算します。本格的な蓄積局面を示し、方向性と目標を示します。 トレンド中でも調整中でも機能するシステムです。 どのように作動するのか? ENIGMERAは、支持線・抵抗線、目標線、乖離線の3つのラインで構成されています。このシステムは、過去のデータを現在と未来に外挿する典型的な市場指標とは異なり、現在の完全な画像を提供します。支持線上にある場合、それは本当の支持を意味し、抵抗線上にある場合、それは本当の抵抗を意味する。ある水準が破られた場合、それはトレンドの変化を意味する。再描画はしない。 市場は常に進化しているため、ENIGMERAはその評価ツールを適応させ、定期的に戦略を修正しています。  これにより、すべてのシナリオが徹底的に評価されることが保証されます。この市場指標の独自性は、その能力を見れば明らかです。  ENIGM
TPSpro TREND PRO は 、市場を自動的に分析し、トレンドとその各変化に関する情報を提供し、再描画せずに取引に参加するためのシグナルを提供するトレンド指標です。 インディケータは各ローソク足を使用し、個別に分析します。さまざまなインパルス(アップまたはダウンインパルス)を指します。通貨、仮想通貨、金属、株、指数の取引への正確なエントリーポイント! バージョンMT5                   インジケーターの完全な説明   インジケーター -   RFI LEVELS と併用することをお勧めします。 主な機能: レンダリングなしで正確な入力信号! シグナルが表示された場合、それは関連性を維持します。これは、シグナルを提供してからそれを変更する可能性があり、入金時の資金の損失につながる可能性があるリドローインジケーターとの重要な違いです。より高い確率と精度で市場に参入できるようになりました。矢印が表示された後、ターゲットに達する (利益確定) か反転シグナルが表示されるまで、ローソク足を色付けする機能もあります。 STOP LOSS / TAKE PROFIT
mql5と Telegramの モーニング・ブリーフィングで、詳細とスクリーンショットを含む毎日のマーケット・アップデートをご覧 ください! FX Power MT4 NGは 、長年の人気を誇る通貨強度計FX Powerの次世代モデルです。 この次世代ストレングスメーターは何を提供するのでしょうか?初代FXパワーの魅力すべて プラス GOLD/XAUの強さ分析 より正確な計算結果 個別に設定可能な分析期間 カスタマイズ可能な計算上限値により、さらに優れたパフォーマンスを実現 もっと見たい人のための特別なマルチインスタンス設定 すべてのチャートでお好みの色を無限に設定可能 数え切れないほどの通知オプションにより、重要なことを見逃すことはありません。 Windows 11とmacOSのスタイルで角を丸くした新しいデザイン 魔法のように動くインジケーターパネル FXパワーの主な機能 すべての主要通貨の強さの完全な履歴 すべての時間枠における通貨の強さの履歴 すべてのブローカーとチャートで同一の計算結果 100%信頼できるリアルタイム計算 -> リペイントなし ドロップダウン・リストから
Gold Stuff
Vasiliy Strukov
4.89 (237)
Gold Stuff は、金専用に設計されたトレンド指標であり、あらゆる金融商品にも使用できます。 インジケーターは再描画せず、遅れません。 推奨時間枠 H1. それインディケータでフルオートExpert Advisor EA Gold Stuffが動作します。 あなたは私のプロフィールでそれを見つけることができます. 設定と個人的なボーナスを得るために、購入後すぐに私に連絡してください! トレンド スキャナーの強力なサポートを利用して、無料のインジケーターを入手し、プライバシーを守ります。あーみー!   設定 矢印を描く - オンオフ。 チャートに矢印を描く。 アラート - 可聴アラートのオンオフ。 メール通知 - オンオフ。 電子メール通知。 プチ通知 - オンオフ。 プッシュ通知。 次に、色域を調整します。 Gold Stuff は、金専用に設計されたトレンド指標であり、あらゆる金融商品にも使用できます。 インジケーターは再描画せず、遅れません。 推奨時間枠 H1. それインディケータでフルオートExpert Advisor EA Gold Stuff
An exclusive indicator that utilizes an innovative algorithm to swiftly and accurately determine the market trend. The indicator automatically calculates opening, closing, and profit levels, providing detailed trading statistics. With these features, you can choose the most appropriate trading instrument for the current market conditions. Additionally, you can easily integrate your own arrow indicators into Scalper Inside Pro to quickly evaluate their statistics and profitability. Scalper Inside
現在20%OFF! 初心者やエキスパートトレーダーのためのベストソリューション! このダッシュボードソフトウェアは、28の通貨ペアで動作しています。それは私達の主要な指標(高度な通貨の強さ28と高度な通貨インパルス)の2に基づいています。それは全体の外国為替市場の大きい概観を与えます。それは、すべての(9)時間枠で28の外国為替ペアのための高度な通貨の強さの値、通貨の動きの速度と信号を示しています。チャート上で1つのインディケータを使用して市場全体を観察し、トレンドやスキャルピングの機会をピンポイントで見つけることができたら、あなたのトレードがどのように改善されるか想像してみてください。 このインディケータには、強い通貨と弱い通貨の識別、潜在的な取引の識別と確認がより簡単になるような機能が搭載されています。このインディケータは、通貨の強さや弱さが増加しているか減少しているか、また、すべての時間枠でどのように機能しているかをグラフィカルに表示します。 新機能として、現在の市場環境の変化に適応するダイナミックなマーケットフィボナッチレベルが追加され、すでに当社のAdvan
現在26%オフ 初心者やエキスパートトレーダーに最適なソリューション! このインジケーターは、独自の機能と新しい計算式を取り入れた、ユニークで高品質、かつ手頃な価格のトレーディングツールです。たった1枚のチャートで28の為替ペアの通貨強度を読み取ることができます。新しいトレンドやスキャルピングチャンスの引き金となるポイントを正確に特定することができるので、あなたのトレードがどのように改善されるか想像してみてください。 ユーザーマニュアルはこちら  https://www.mql5.com/en/blogs/post/697384 これが最初の1本、オリジナルだ! 価値のないクローンを買わないでください。 特別な サブウィンドウの矢印で強い通貨の勢いを表示 GAPがあなたのトレードを導く! 基準通貨や気配値が売られすぎ・買われすぎのゾーン(外相フィボナッチレベル)にあるとき、個別チャートのメインウィンドウに警告表示。 通貨がレンジの外側から反落した場合、プルバック/リバーサルのアラート。 クロスパターンの特別なアラート 複数の時間枠を選択可能で、トレンドを素早く
トレンドカッターは、M1 や M5 などの下位時間枠を含むあらゆる時間枠で使用できるトレンド指標です。このインジケーターは日中取引を好むトレーダーにとって理想的であり、長期取引を好むトレーダーにも役立ちます。このインジケーターは、取引システムの基礎として、またはスタンドアロンの取引ソリューションとして使用できます。 このインジケーターは、PUSH 通知を含むあらゆるタイプのアラートを提供します。 インジケーターの使い方はとても簡単です。信号に従えばいいだけです。また、このインジケーターのすべてのユーザーに、このメソッドをできるだけ効率的に使用するのに役立つ追加のインジケーターも無料で提供します。 取引のヒントと素晴らしいボーナスを入手するには、購入後にご連絡ください。
Advanced Supply Demand
Bernhard Schweigert
4.91 (294)
現在33%オフ 初心者にもエキスパートトレーダーにも最適なソリューション このインジケーターは独自の機能と新しい公式を多数内蔵しており、ユニークで高品質かつ手頃な取引ツールです。このアップデートでは、2つの時間枠ゾーンを表示できるようになります。より長いTFだけでなく、チャートTFとより長いTF(ネストゾーンを表示)の両方を表示できます。すべてのSupply Demandトレーダーの皆さんのお気に召すはずです。:) 重要情報の公開 Advanced Supply Demandの可能性を最大化するには、 https://www.mql5.com/ja/blogs/post/720245 にアクセスしてください。   エントリーまたはターゲットの正確なトリガーポイントを正確に特定できれば取引がどのように改善されるか想像してみてください。新しい基盤となるアルゴリズムに基づいて構築されているため、買い手と売り手の間の潜在的な不均衡をさらに簡単に特定できます。これは、最も強い需要と供給のゾーンと、過去のパフォーマンス(古いゾーンを表示)がグラフィカルに表現されるためです。これらの機能は、最適
現在31%オフ! 初心者やエキスパートトレーダーに最適なソリューション! このインジケータは、独自の機能と秘密の数式を組み込んだ、ユニークで高品質かつ手頃な価格のトレーディングツールです。たった1枚のチャートで28の通貨ペアのアラートを表示します。新しいトレンドやスキャルピングチャンスの引き金となるポイントを正確に把握することができるので、あなたのトレードがどのように改善されるか想像してみてください! 新しい基本的なアルゴリズムに基づいて構築されているため、潜在的な取引の特定と確認がより簡単になります。これは、通貨の強さや弱さが加速しているかどうかをグラフィカルに表示し、その加速のスピードを測定するためです。加速すると物事は明らかに速く進みますが、これはFX市場でも同じです。つまり、反対方向に加速している通貨をペアにすれば、利益を生む可能性のある取引を特定することができるのです。 通貨の勢いを示す縦の線と矢印は、あなたの取引の指針となるでしょう。 ダイナミックマーケットフィボナッチ23レベルはアラートトリガーとして使用され、市場の動きに適応します。もしインパルスが黄色
Please contact me after purchase to immediately get your PDF strategy + documentation for Trend Pulse !  Official release price of $79  (3 /50 copies left). Next price is $129 . Introducing Trend Pulse , a unique and robust indicator capable of detecting bullish, bearish, and even ranging trends! Trend Pulse uses a special algorithm to filter out market noise with real precision. If the current symbol is moving sideways, Trend Pulse will send you a ranging signal, letting you know that it'
TakePropips Donchian Trend Pro
Eric John Pajarillaga Aldana
4.53 (15)
TakePropips Donchian Trend Pro   (MT4) は、ドンチャン チャネルを使用してトレンドの方向を自動的に検出し、エントリーとエグジットの取引シグナルを提供する強力で効果的なツールです! この多機能インジケーターには、トレンド スキャナー、取引シグナル、統計パネル、スクリーナー、取引セッション、およびアラート履歴ダッシュボードが含まれます。取引シグナルを提供し、チャートを分析する時間を節約するように設計されています! ユーザー マニュアルとインストール ガイドは、ブログ投稿 (   https://www.mql5.com/en/blogs/post/751368   ) からダウンロードできます。 今日は 50% オフ! 98ドルから49ドルに値下げ! このインジケーターは、ストラテジー テスターでテストできます (ビジュアル モードを有効にします)。 詳細については、説明の下にあるビデオ チュートリアルも利用できます。 ご不明な点やサポートが必要な場合は、私に連絡してください。 TakePropips Donchian Trend Pro イン
Order Block Hunter
Noha Mohamed Fathy Younes Badr
5 (2)
Order block hunter indicator is the best indicator for  hunt the order blocks that area where there has been a large concentration of limit orders waiting to be executed Order blocks are identified on a chart by observing previous price action and looking for areas where the price experienced significant movement or sudden changes in direction .This indicator does that for you by using very complicated codes and helps you to take the best areas To buy and sell because it make marks at the best a
これはMT4のインジケーターで、再描画なしで取引に参入するための正確なシグナルを提供します。 外国為替、暗号通貨、金属、株式、インデックスなど、あらゆる金融資産に適用できます。かなり正確な見積もりを提供し、取引を開始して終了するのに最適な時期を教えてくれます。1つのシグナルを処理しただけでインジケーターの元が取れた例の 動画 (6:22)をご覧ください。Entry PointsPro インジケーターの助けを借りたほとんどのトレーダーの最初の1週間の結果が改善しています。 Telegramグループ に登録してください。Entry Points Proインジケーターのメリットは次の通りです。 再描画のないエントリーシグナル 再描画されるインジケーターでは一度表示されたシグナルが削除されて大きな金銭的損失につながることがありますが、これと異なり、表示されて確認されたシグナルは消えることがありません。 エラーなしの取引開始 インジケーターアルゴリズムによって取引を開始する(資産を売買する)理想的な瞬間を見つけることができます。それを使用するすべてのトレーダーの成功率が向上します。
通貨強さウィザードは、取引を成功させるためのオールインワン ソリューションを提供する非常に強力な指標です。このインジケーターは、複数の時間枠のすべての通貨のデータを使用して、このまたはその外国為替ペアのパワーを計算します。このデータは、使いやすい通貨インデックスと通貨パワーラインの形式で表され、特定の通貨のパワーを確認するために使用できます。 必要なのは、取引したいチャートにインジケーターを接続することだけです。インジケーターは、取引する通貨の実際の強さを示します。このインジケーターは、トレンドに合わせて取引するときに有利に利用できる売買高の圧力の極値も示します。このインジケーターには、フィボナッチに基づく可能なターゲットも表示されます。 このインジケーターは、PUSH 通知を含むあらゆるタイプのアラートを提供します。 購入後ご連絡下さい。私の取引のヒントをあなたと共有し、素晴らしいボーナスインジケーターを無料で提供します! 幸せで有益な取引をお祈りします。
NextCandlePredictor インジケーター NextCandlePredictorは、再描画しない、色が変わらない、動かない、消えない、遅延がないアラート付きのシグナルインジケーターです。あらゆるタイムフレームで次のキャンドルまたはその次のキャンドルの方向を識別するのに役立ちます。ニューヨーク、ロンドン、またはその両方の重なり合う高ボラティリティ市場に特にお勧めです。 主な特徴: タイムフレームの汎用性: M1からH1以上のあらゆるタイムフレームで迅速かつ正確なシグナルを提供します。 明確な買い/売りシグナル: ADXのDI+とDI-ラインを使用して明確な買いと売りのシグナルを生成し、最良のトレード判断を下せるようにします。 直感的な視覚化: シグナルはチャート上に緑色(買い)と赤色(売り)の矢印で直接表示され、迅速かつ簡単に読み取れます。 カスタマイズ可能な設定: 分析するバーの数とアラートオプションを好みとトレード戦略に応じて調整できます。使用するTFに応じた提案表を以下で確認してください。 即時およびオプションのキャンドル終了時アラート: デフォルトでは、ADX条件が
FX Volume
Daniel Stein
4.58 (33)
mql5と Telegramの モーニング・ブリーフィングで、詳細とスクリーンショットを含む毎日のマーケット・アップデートをご覧 ください! FX Volumeは、ブローカーの視点から市場のセンチメントをリアルに洞察する、最初で唯一の出来高インジケーターです。 ブローカーのような機関投資家が外国為替市場でどのようなポジションをとっているか、COTレポートよりもはるかに速く、素晴らしい洞察を提供します。 この情報をチャート上で直接見ることは、あなたの取引にとって真のゲームチェンジャーであり、画期的なソリューションです。 以下のようなユニークなマーケットデータ洞察から利益を得てください。 比率は 、通貨のロングポジションとショートポジションの比率をパーセントで表示します。 比率の変化は 、選択した期間内のロング比率とその変化率を表示します。 Volumes Totalは 、通貨の取引量(ロングとショート)の合計をロット単位で表示します。 Volumes Long :全通貨のロングポジションの取引量を表示します。 Volumes(ショート )は、全通貨のショートポジションの取引量を表示
Indicator : RealValueIndicator Description : RealValueIndicator is a powerful tool designed specifically for trading on the EURUSD pair. This indicator analyzes all EUR and USD pairs, calculates their real currency strength values, and displays them as a single realistic value to give you a head start on price. This indicator will tell you moves before they happen if you use it right. RealValueIndicator allows you to get a quick and accurate overview of the EURUSD currency pair tops and bottoms,
Cycle Sniper
Elmira Memish
4.37 (35)
NEW YEAR SALE PRICE FOR LIMITED TIME!!! Please contact us after your purchase and we will send you the complimentary indicators to complete the system Cycle Sniper is not a holy grail but when you use it in a system which is explained in the videos, you will feel the difference. If you are not willing to focus on the charts designed with Cycle Sniper and other free tools we provide, we recommend not buying this indicator. We recommend watching the videos about the indiactor and system before pu
もちろんです。以下は、提供いただいたテキストの日本語への翻訳です: MT4用の天文学指標をご紹介します:究極の天体トレーディングコンパニオン トレーディング体験を天空の高みに高める準備はできていますか?私たちの革命的なMT4用の天文学指標をご紹介します。この革新的なツールは、複雑なアルゴリズムの力を借りて、類まれなる天文学的洞察と精密な計算を提供します。 あなたの指先で宇宙の情報を: 宝のような天文学的データが明らかになる包括的なパネルをご覧ください。惑星の地理的/太陽中心座標、太陽と地球の距離、星の大きさ、伸び、星座、黄道座標および赤道座標、さらには水平座標まで、それぞれが綿密に計算され美しく表示されています。指標によって生成される垂直線は時間値に対応し、トレーディングの旅に宇宙の視点を提供します。 惑星のラインと関係: グラフを飾る惑星のラインの魔法を体験し、スケールと角度をカスタマイズできます。直感的なコントロールパネルを介して各惑星のラインの表示を簡単に切り替えることができます。指定された時刻範囲内での合会、六分会、四分会、三分会、対会、逆行の指標で天体の関係の芸術を発見してく
Ultimate Sniper Dashboard
Hispraise Chinedum Abraham
4.82 (22)
299ドルで割引中! 今後値上げの可能性あり! 下の説明を読んでください! 究極のスナイパーダッシュボードのための最高のエントリーシステム。究極のダイナミックレベル。(私の製品をチェックしてください) 究極のスナイパーダッシュボードはMT4多通貨テスト制限のため、ライブマーケットでのみ作動します。 究極のスナイパーダッシュボードをご紹介します。HA-Sniper、MA-Sniper、その他多くの特別なモードが含まれる最高の製品です。究極のスナイパーダッシュボードは絶対的な獣です! 初心者やエキスパートトレーダーにとって最高のソリューションです。もう二度と動きを見逃さない! シンプルさとピップを愛するトレーダーのために、特別な製品をご用意しました。シンプルでありながら、ダッシュボードは複数のカスタムアルゴリズムに基づき28の通貨ペアを監視し、すべての作業を行います。たった一つのチャートで、プロのように市場を読み解くことができます。もし、為替ペアが動き出したときに、その方向性を正確に特定することができれば、あなたの取引はどれほど改善されることでしょう。   当社のシ
Scalper Vault は、スキャルピングを成功させるために必要なすべてを提供するプロフェッショナルなスキャルピング システムです。このインジケーターは、外国為替およびバイナリー オプションのトレーダーが使用できる完全な取引システムです。推奨される時間枠は M5 です。 システムは、トレンドの方向に正確な矢印シグナルを提供します。また、トップとボトムのシグナルとギャン マーケット レベルも提供します。 インジケーターは、プッシュ通知を含むすべてのタイプのアラートを提供します。 インジケータの購入後にご連絡ください。私の個人的な取引の推奨事項と素晴らしいボーナス指標を無料で共有します! 幸せで有益な取引をお祈りします!
ON Trade Waves Patterns Harmonic Elliot Wolfeをご紹介します。これは手動および自動の方法を使用して市場のさまざまなパターンを検出するために設計された高度なインジケーターです。以下はその動作方法です: ハーモニックパターン: このインジケーターは、チャートに表示されるハーモニックパターンを識別できます。これらのパターンは、Scott Carneyの「Harmonic Trading vol 1および2」で説明されているように、ハーモニックトレーディング理論を実践するトレーダーにとって重要です。手動で描画するか、自動検出に頼るかにかかわらず、ON Trade Waves Patternsがお手伝いします。 コントロールパネル: このインジケーターはユーザーフレンドリーなコントロールパネルを備えています。チャートと時間枠の設定を保存し、異なる構成間をスムーズに切り替えることができます。チャートスペースを最大限に活用するために最小化することもできます。他の分析ツールで作業することを好む場合、閉じるボタンをクリックするだけで、すべてのインジケーターデ
現在20%OFF! 初心者やエキスパートトレーダーに最適なソリューションです。 このインディケータは、エキゾチックペア・コモディティ・インデックス・先物など、あらゆるシンボルの通貨の強さを表示することに特化したインディケータです。金、銀、原油、DAX、US30、MXN、TRY、CNHなどの通貨の強さを表示するために、9行目にどのシンボルでも追加することができます。独自の機能を多数搭載し、新しい計算式を採用したため、ユニークで高品質、かつ手頃な価格のトレーディングツールとなっています。新しいトレンドやスキャルピングチャンスのトリガーポイントを正確に把握することができるため、あなたのトレードがどのように改善されるか想像してみてください。 ユーザーマニュアル:ここをクリック   https://www.mql5.com/en/blogs/post/708876 すべての時間枠に対応します。あなたはすぐにトレンドを見ることができるようになります! 新しいアルゴリズムに基づいて設計されているため、潜在的な取引の特定と確認がより簡単になります。これは、8つの主要通貨と1つのシンボ
3 Indicators in 1 indicator Strategy based on price action Made specifically for the best forex currency pairs Can be used in the best time frame of the market at a very reasonable price This indicator is basically 3 different indicatos . But we have combined these 3 indicators in 1 indicator so that you can use 3 indicators at the lowest price. All three strategies are based on price action. But based on different trends. Long term, medium term and short term Attributes : No repaintin
Introducing Volume Orderflow Profile , a versatile tool designed to help traders visualize and understand the dynamics of buying and selling pressure within a specified lookback period. Perfect for those looking to gain deeper insights into volume-based market behavior! MT5 Version -  https://www.mql5.com/en/market/product/122657 The indicator gathers data on high and low prices, along with buy and sell volumes, over a user-defined period. It calculates the maximum and minimum prices during this
TPA True Price Action indicator reveals the true price action of the market makers through 100% non-repainting signals (except early signals mode) strictly at the close of a candle! TPA shows entries and re-entries, every time the bulls are definitely stronger than the bears and vice versa. Not to confuse with red/green candles. The shift of power gets confirmed at the earliest stage and is ONE exit strategy of several. There are available now two free parts of the TPA User Guide for our custo
作者のその他のプロダクト
Moving Average Filter
Shellard Securities (Pty) Ltd
3 (2)
This is a filter of various moving average combinations used to give a higher level of confidence to trade entries. The indicator may be used with moving averages on the chart or independently by itself to show the current trend direction. Trade signals of the Moving Average Filter are based on the Price (1EMA) vs the 14EMA, the 14EMA vs the 50EMA, the 50EMA vs the 100EMA, and the 100EMA vs the 200EMA. Trade signals are produced when all of the filters are in alignment, thus showing all green or
Scalping Filter
Shellard Securities (Pty) Ltd
Advanced Scalping Filter to be used on any major currency pair. Designed for the 15 minute time-frame, however the filter should also work efficiently on the 5 minute time-frame. This filter takes into account various conditions of MACD's, Moving Averages, as well as current price positioning, to produce recommended buy, sell, or exit signals (as green for buy, red for sell, and orange for exit). Ideal for quick 10 pip profits or for exit signal to occur.
Advanced Trend Regime
Shellard Securities (Pty) Ltd
The indicator has been designed to function on any time-frame and any pair.   This regime filter will help the trader better evaluate whether the current market is trending, and in which direction. It quickly reacts to changes in market dynamics using a series of advanced calculations. The user is able to select whether the calculation remains standard, or if a further filter constraint is added to the calculation.   A Yellow moving average of the signal has been included for the trader to smoot
Price Matrix
Shellard Securities (Pty) Ltd
The dashboard indicator has been designed to quickly show the trader the price movements of various currency pairs.   The user is able to select 3 different timeframes to analyse. When the pip difference for each respective timeframe is either positive or negative, the pair block will be coloured green or red respectively. This allows the trader to view which timeframes are in agreement, as well as the pip movements therein.   A good visual tool to view multiple pairs and timeframes at once.   T
Trend Direction Filter
Shellard Securities (Pty) Ltd
The indicator has been designed to function on any time-frame and any pair, although it is best suited for 5-minute charts.   This trend filter will help the trader better evaluate whether the current market is trending, and in which direction. A dynamic filter threshold has been added to help the trader avoid choppy market conditions, and add greater confidence when entering, with an added functionality of plotting signal arrows on the chart to aid in detecting possibly entries.   The Yellow in
Trend Volatility
Shellard Securities (Pty) Ltd
The indicator has been designed to function on any time-frame and any pair, although it is best suited for currency pairs on 5-minute charts, and used in conjunction with the Trend Direction Filter Indicator .   This trend volatility filter will help the trader better evaluate whether the current market is trending, and in which direction. A dynamic filter threshold has been added to help the trader avoid choppy market conditions, and add greater confidence when entering, with an added functiona
Transformed Trend
Shellard Securities (Pty) Ltd
The indicator has been designed to function on any time-frame and any pair, although it is best suited for 5-minute charts.   This price transformation will help the trader better evaluate whether the current market is trending, and in which direction. A dynamic filter has been added to help the trader avoid possibly entering against the trend. Two filter threshold lines may enable the trader to avoid choppy or flat market conditions.   The Yellow indicator line is the filter and the Blue indica
フィルタ:
レビューなし
レビューに返信