• 概要
  • レビュー
  • コメント

Revers Uni

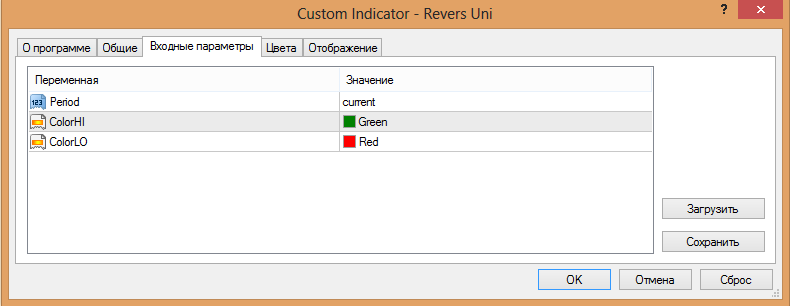
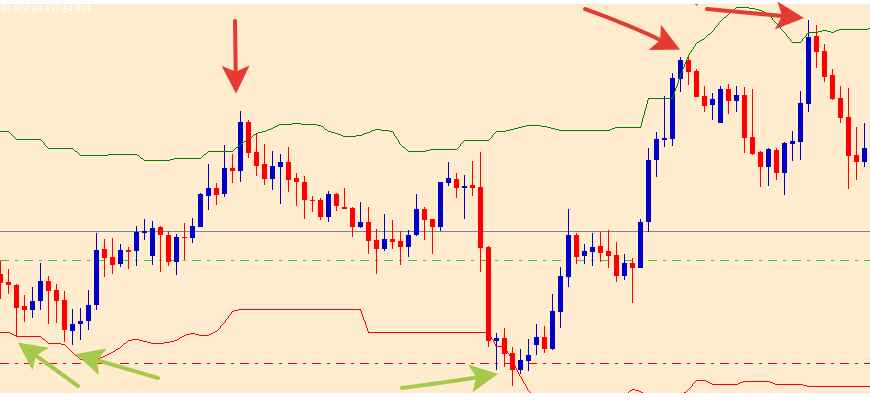
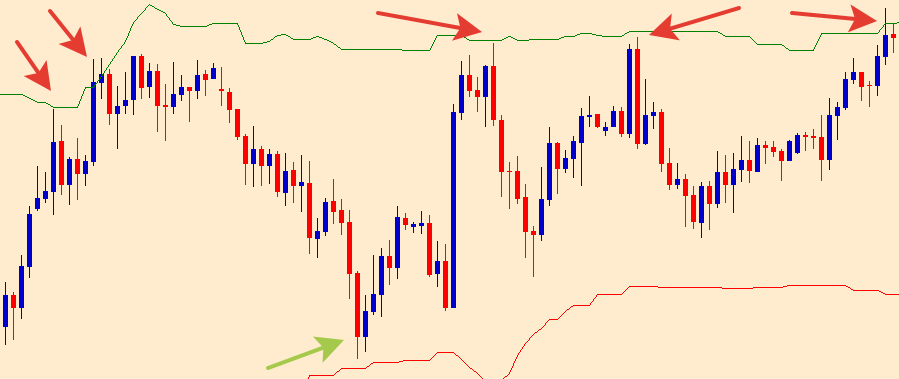
Индикатор разворота цены основанный на анализе трех таймфреймов. Когда вы выбираете параметр PERIOD, индикатор проводит рассчет по выбранному периоду и на два периода выше. Период М30 в рассчетах никак не участвует и его выбирать не рекомендуется. Максимальный верхний период для правильного рассчета применяйте не выше D1, т.к. в него уже войдут периоды  W1 и MN. Период для установки индикатора выбирайте произвольно, а для более точного входа, я рекомендую М1,М5 и М15.
おすすめのプロダクト
ナイト ゴースト - バイナリ オプションの矢印インジケーター。 これからのあなたの頼もしいアシスタントです! 11 - チャートの再描画なし - すべての通貨ペアで大活躍! -インジケータの精度は最大 90% (特に夜間) ・長時間の設定不要(バイナリーオプションに最適な設定) - 信号が遅れない - 現在のローソク足でのシグナルの出現 ・M1期にピッタリ(No More!) ・目に優しいキャンドルカラー(赤・青) -インストールされたアラート それを扱う: - 青い矢印は信号アップを示します -赤い下向き矢印 M1 以上のインジケーターをチャートに配置しないでください. シグナルの精度が低下します! インジケーターのスクリーンショットとビデオを見る
これは、キャンドルの終値を予測する指標です。 このインジケータは、主にD1チャートでの使用を目的としていますが. この指標は、従来の外国為替取引とバイナリオプション取引の両方に適しています。 インジケーターは、スタンドアロンのトレーディングシステムとして使用することも、既存のトレーディングシステムへの追加として機能させることもできます。 このインジケーターは、現在のキャンドルを分析し、キャンドル自体の内部の特定の強度係数と、前のキャンドルのパラメーターを計算します。 したがって、この指標は、市場の動きのさらなる方向性と現在のキャンドルの終値を予測します。 この方法のおかげで、この指標は、短期の日中取引だけでなく、中期および長期の取引にも適しています。 インジケーターを使用すると、市場の状況の分析中にインジケーターが生成する潜在的な信号の数を設定できます。 インジケーターの設定には、このための特別なパラメーターがあります。 また、インジケーターは、チャート上のメッセージの形式で、電子メールで、およびPUSH通知の形式で、新しい信号について通知することができます。 購入後は必ず私に書いて
フィボナッチリトレースと拡張ラインツール DiNapoliポイント取引方法とゴールデンセクション取引を使用するトレーダーにとって理想的なMT4プラットフォームのフィボナッチリトレースと拡張ラインツール 主な特長: あなたはフィボナッチリトレースメントの複数のセットを直接描くことができ、重要なリターンポイント間の関係は一目瞭然です。 2.フィボナッチ拡張を描画することができます。 3.フィボナッチフォールドバックとラインの延長は、簡単な観察と数値表示のために左右に動かすことができます。 4.チャートは非常に爽やかな 5.数字キーでサイクルを切り替えることができます。 ファンクションキー: 1。 [戻るを押す、要求に応じて描画する、最大8つのグループにする 2。拡張]を描くには[押す] 3。 \を押すと、現在のサイクルの下にあるすべての拡張機能と折り畳みが削除されます 4。フォールドバックを移動して削除して展開する (1)最初のフォールドバックセットのF5行をクリックします。 一度クリックすると(黄色に変わります)、キーボードのDel
This unique multi-currency strategy simultaneously determines the strength of trends and market entry points, visualizing this using histograms on the chart. The indicator is optimally adapted for trading on the timeframes М5, М15, М30, Н1. For the convenience of users, the indicator renders the entry point (in the form of an arrow), recommended take profit levels (TP1, TP2 with text labels) and the recommended Stop Loss level. The take profit levels (TP1, TP2) are automatically calculated for
Binary Options Support Resistance Indicator This indicator is designed for binary options trading and effectively shows retracements from support and resistance levels. Signals appear on the current candle. A red arrow pointing downwards indicates a potential selling opportunity, while a blue arrow pointing upwards suggests buying opportunities. All that needs adjustment is the color of the signal arrows. It is recommended to use it on the M1-M5 timeframes as signals are frequent on these timef
VR Cub
Vladimir Pastushak
VR Cub は、質の高いエントリーポイントを獲得するためのインジケーターです。このインジケーターは、数学的計算を容易にし、ポジションへのエントリーポイントの検索を簡素化するために開発されました。このインジケーターが作成されたトレーディング戦略は、長年にわたってその有効性が証明されてきました。取引戦略のシンプルさはその大きな利点であり、初心者のトレーダーでもうまく取引することができます。 VR Cub はポジション開始ポイントとテイクプロフィットとストップロスのターゲットレベルを計算し、効率と使いやすさを大幅に向上させます。取引の簡単なルールを理解するには、以下の戦略を使用した取引のスクリーンショットを見てください。 設定、設定ファイル、デモ版、説明書、問題解決方法は、以下から入手できます。 [ブログ] レビューを読んだり書いたりすることができます。 [リンク] のバージョン [MetaTrader 5] エントリーポイントの計算ルール ポジションをオープンする エントリーポイントを計算するには、VR Cub ツールを最後の高値から最後の安値までストレッチする必要があります。
Was: $249  Now: $99   Market Profile defines a number of day types that can help the trader to determine market behaviour. A key feature is the Value Area, representing the range of price action where 70% of trading took place. Understanding the Value Area can give traders valuable insight into market direction and establish the higher odds trade. It is an excellent addition to any system you may be using. Blahtech Limited presents their Market Profile indicator for the MetaTrader community. Ins
これは、従来のMACDよりも正確で使いやすいユニークなMACD指標です。 それはあらゆるチャートサイクルに適しており、あらゆる市場の種類に適しています。 赤い列は(Buy)バンドの信号、青い列は(Sell)バンドの信号です。 黄色と緑色の線は傾向線で、2本の線は交差しません。 購入する:青い列で、真ん中の0軸を通る緑色の線を見てください。 売り:赤い列で、真ん中の0軸の下の黄色い線を見てください。 MACDの形態信号からの偏差は99%正確です。 購入フォームからの逸脱:バンドの価格がバンドより低く、インディケータのインデックスがますます高くなっていますこの場合、すぐに買い注文をすることができます。 売りからの逸脱:バンドの価格がバンドより高く、インディケータのインデックスが小さくなってきているこの場合、売りシングルはすぐに実行できます。 注:指標の五芒星は、価格の変動により変化します。
インディケータは現在のクオートを作成し、これを過去のものと比較して、これに基づいて価格変動予測を行います。インジケータには、目的の日付にすばやく移動するためのテキスト フィールドがあります。 オプション: シンボル - インジケーターが表示するシンボルの選択; SymbolPeriod - 指標がデータを取る期間の選択; IndicatorColor - インジケータの色; HorisontalShift - 指定されたバー数だけインディケータによって描画されたクオートのシフト; Inverse - true は引用符を逆にします。false - 元のビュー。 ChartVerticalShiftStep - チャートを垂直方向にシフトします (キーボードの上下矢印)。 次は日付を入力できるテキストフィールドの設定で、「Enter」を押すとすぐにジャンプできます。
This indicator has been created for finding the probable reversal points of the symbol price. A small candlestick reversal pattern is used it its operation in conjunction with a filter of extremums. The indicator is not redrawn! If the extremum filter is disabled, the indicator shows all points that have a pattern. If the extremum filter is enabled, the condition works – if the history Previous bars 1 candles back contains higher candles and they are farther than the Previous bars 2 candle, such
FREE
TrendPlus
Sivakumar Subbaiya
4.21 (14)
Trend Plus   Trendplus  Indicator   Time Frame: Suitable for any time frame.  Purpose: Trend Prediction. Blue and red candle indicate the buy and sell call respectively. Buy: When the blue candle is formed buy call is initiated. close the buy trades when the next red candle will formed.   Sell: When the Red candle is formed Sell call is initiated. close the Sell trades when the next blue candle will formed.   Happy trade!!
FREE
Gioteen Volatility Index (GVI)   - your ultimate solution to overcoming market unpredictability and maximizing trading opportunities. This revolutionary indicator helps you in lowering your losing trades due to choppy market movements. The GVI is designed to measure market volatility, providing you with valuable insights to identify the most favorable trading prospects. Its intuitive interface consists of a dynamic red line representing the volatility index, accompanied by blue line that indicat
We present you the indicator "Candle closing counter", which will become your indispensable assistant in the world of trading. That’s why knowing when the candle will close can help: If you like to trade using candle patterns, you will know when the candle will be closed. This indicator will allow you to check if a known pattern has formed and if there is a possibility of trading. The indicator will help you to prepare for market opening and market closure. You can set a timer to create a p
Trend PA
Mikhail Nazarenko
5 (3)
The Trend PA indicator uses   Price Action   and its own filtering algorithm to determine the trend. This approach helps to accurately determine entry points and the current trend on any timeframe. The indicator uses its own algorithm for analyzing price changes and Price Action. Which gives you the advantage of recognizing, without delay, a new nascent trend with fewer false positives. Trend filtering conditions can be selected in the settings individually for your trading style. The indicator
トレンドキャッチャー: アラートインジケーター付きのトレンドキャッチャーストラテジーは、市場トレンドやポテンシャルなエントリーポイントやエグジットポイントを特定するのに役立つ多目的な技術分析ツールです。動的なトレンドキャッチャーストラテジーを備えており、市場状況に適応してトレンドの方向を明確に視覚化します。トレーダーは、自身の好みやリスク許容度に合わせてパラメーターをカスタマイズできます。このインジケーターはトレンドの識別を支援し、ポテンシャルなリバーサルをシグナルし、トレイリングストップのメカニズムとして機能し、市場への迅速な対応のためのリアルタイムアラートを提供します。 特徴: - トレンドの識別:上昇トレンドと下降トレンドをシグナルします。 - トレンドのリバーサル:ローソク足の色が上昇から下降に変わった場合やその逆の場合に、ポテンシャルなリバーサルを警告します。 - リアルタイムアラート:新しいトレンドの識別に対するアラートを生成します。 推奨事項: - 通貨ペア:EURUSD、AUDUSD、XAUUSDなど... - タイムフレーム:H1。 - アカウン
FREE
Sto Signal AM
Andriy Matviyevs'kyy
5 (1)
This indicator displays Stochastic osc signals on the price chart and allows the user to receive notifications of such signals. The Stochastic indicator is a classic and proven indicator of the technical analysis of the markets. Despite its age, it is still relevant today. Depending on the settings, the indicator allows you to work effectively on various TFs and any markets. Signals are given on fully formed bars and are not redrawn. Custom Parameters: Stochastic_Price (0-1) - The applied pric
FREE
The indicator allows you to trade binary options. The recommended time frame is М1 and the expiration time is 1,2,3 minutes. The indicator suitable for auto and manual trading. A possible signal is specified as a arrows above/under a candle. You should wait until the candle closes! Arrows are not re-painted Trade sessions: TOKYO section (Half-end) Currency pairs: USD/JPY Working time frame: M1 Expiration time: 1,2,3 minutes. The indicator also shows good results when using the martingale strateg
FREE
This is a trend indicator without redrawing Developed instead of the binary options strategy (by the color of the Martingale candlestick) Also works well in forex trading When to open trades (binary options) A signal will appear in the place with a candle signaling the current candle It is recommended to open a deal for one candle of the current timeframe M1 and M5 When a blue dot appears, open a deal up When a red dot appears, open a trade down. How to open trades on Forex. When a signal is rec
The   True Magic Oscillator   indicator is designed for signal trading. This indicator generates trend signals. It uses many algorithms and indicators to generate this signal. It tries to generate signals from the points with the highest trend potential. This indicator is a complete trading product. This indicator does not need any additional indicators. The indicator is never repainted. The point at which the signal is given does not change.         Features and Recommendations Wor
The indicator shows you buy/sell signals and does not repaint. It works well with almost all pairs, while the best ones are GBPUSD, XAUUSD and EURUSD. The product works better on H1 and H4. You can change the parameters in the inputs tab to get the best signals and the best trade results on each pair. You can enable/disable alerts when signal appears. The indicator is easy to use. Parameters barstrip & Sensitive: amount of bars to process the highest and lowest prices (relates to the internal
This is a Binary Options signal indicator. Extremely powerful for the 1 min chart. The signals are based on my personal tweak (based on real trial and error & backtested) of the RSI, ADX and Ichimoku and my observation on how price moves. It turns out, 2 candles expiry is the most consistent with this set up. How to use: 1. Wait for arrow signal to show. 2. Place a 2 candle expiry right after the close of the signal candle. So if you are trading a 1 min chart, place an expiry for 2 mins... if yo
[ZhiBiCCI]インディケータは全てのサイクル使用に適しており、そして全ての市場品種にも適しています。 [ZhiBiCCI]緑色の実線は強気の発散の逆転です。緑色の点線は古典的な強気の発散です。 [ZhiBiCCI]赤への実線は逆弱気の発散である。赤い点線は古典的な弱気の発散です。 [ZhiBiCCI]はパラメータ(アラート、メール送信、通知送信)で設定でき、(true)に設定するとインスタント信号をアラームウィンドウに送信し、Eメール、インスタントメッセージを送信できます。 パラメータ設定の説明 [displayAlert]:これはアラームスイッチで、trueに設定され、矢印が表示されればプロンプトに自動的に警告され、falseに設定されれば警告されません。 [sendmail_NO_OFF]:これはメールを送信するためのスイッチで、trueに設定します。矢印が表示されていればMT4で設定したメールボックスにメールを送信し、falseに設定されていればメールを送信しません。 [sendnotification_NO_OFF]:これはインスタントメッセー
MT4用FXインジケーター「ATRトレーリングストップ」 MT4 用の優れた補助 ATR トレーリング ストップ インジケーターを使用して、取引方法をアップグレードします。 このインジケーターはトレーリングストップの目的に最適です ATRトレーリングストップは市場のボラティリティに自動的に適応します 遅延がなく、セットアップも簡単 このインジケーターは、メイントレンドの方向への価格アクションエントリーと組み合わせるのに最適です。 // さらに優れたエキスパートアドバイザーとインジケーターはここから入手できます: https://www.mql5.com/en/users/def1380/seller // また、収益性が高く、安定していて信頼性の高いシグナル https://www.mql5.com/en/signals/1887493 に参加することも歓迎します。 当MQL5サイトのみで提供しているオリジナル商品です。
This is a new strategy for SUPPLY DEMAND areas It is based on a calculation using the tick volume to detect the big price action in market for both bear /bull actions this smart volume action candles are used to determine the supply and demand areas prices in between main supply and demand lines indicate sideway market  up arrows will be shown when prices moves above the main supply and the secondary supply lines Down arrows will be shown when prices moves below the main demand and the secondary
Strong Retracement Points Pro demo edition! SRP (Strong Retracement/Reversal Points) is a powerful and unique support and resistance indicator. It displays the closest important levels which we expect the price retracement/reversal! If all level are broken from one side, it recalculates and draws new support and resistance levels, so the levels might be valid for several days depending on the market! If you are still hesitating to start using this wonderful tool, you can check this link to see h
The Th3Eng PipFinite indicator is based on a very excellent analysis of the right trend direction with perfect custom algorithms. It show the true direction and the best point to start trading. With StopLoss point and Three Take Profit points. Also it show the right pivot of the price and small points to order to replace the dynamic support and resistance channel, Which surrounds the price. And Finally it draws a very helpful Box on the left side on the chart includes (take profits and Stop loss
The indicator shows the potential trend direction by cyclical-wave dependence. Thus, all the rays of the intersection will be optimal rays, in the direction of which the price is expected to move, taking into account the indicator period. Rays can be used as a direction for potential market movement. But we must not forget that the approach must be comprehensive, the indicator signals require additional information to enter the market.
Forex Gump
Andrey Kozak
2.83 (6)
Forex Gump is a fully finished semi-automatic trading system. In the form of arrows, signals are displayed on the screen for opening and closing deals. All you need is to follow the instructions of the indicator. When the indicator shows a blue arrow, you need to open a buy order. When the indicator shows a red arrow, you need to open a sell order. Close orders when the indicator draws a yellow cross. In order to get the most effective result, we recommend using the timeframes H1, H4, D1. There
Scalping Modulator is a scalping trading system. The indicator consists of several analytical modules. It automatically analyzes the market and shows the trader all the necessary information for trading. Scalping Modulator draws two trend lines on the chart. One line shows the long-term direction of the price, the second line shows the medium-term direction of the price. The indicator also draws red and blue dots on the chart. They indicate a likely change in price movement. In order to open a
このプロダクトを購入した人は以下も購入しています
まず第一に、この取引インジケーターは再描画されず、再描画されず、遅延しないことを強調する価値があります。これにより、手動取引とロボット取引の両方に理想的なものになります。 ユーザーマニュアル:設定、入力、戦略。 アトミックアナリストは、価格の強さとモメンタムを利用して市場でより良いエッジを見つけるためのPA価格アクションインジケーターです。ノイズや誤ったシグナルを除去し、取引ポテンシャルを高めるための高度なフィルターを備えています。複雑なインジケーターの複数のレイヤーを使用して、アトミックアナリストはチャートをスキャンし、複雑な数学的計算をシンプルなシグナルと色に変換します。これにより、どのような初心者トレーダーでも理解して使用し、一貫した取引の決定を行うことができます。 「アトミックアナリスト」は、新規および経験豊富なトレーダー向けにカスタマイズされた包括的な取引ソリューションです。プレミアムインジケーターとトップノッチの機能を1つの取引戦略に組み合わせ、すべてのタイプのトレーダーにとって汎用性のある選択肢にします。 デイリートレーディングとスキャルピング戦略:高
Reversal First Impulse levels (RFI)    INSTRUCTIONS        RUS       -       ENG              R ecommended to use with an indicator   -   TREND PRO -  Version MT5 A key element in trading is zones or levels from which decisions to buy or sell a trading instrument are made. Despite attempts by major players to conceal their presence in the market, they inevitably leave traces. Our task was to learn how to identify these traces and interpret them correctly. Main functions: Displaying active zones
An exclusive indicator that utilizes an innovative algorithm to swiftly and accurately determine the market trend. The indicator automatically calculates opening, closing, and profit levels, providing detailed trading statistics. With these features, you can choose the most appropriate trading instrument for the current market conditions. Additionally, you can easily integrate your own arrow indicators into Scalper Inside Pro to quickly evaluate their statistics and profitability. Scalper Inside
現在20%OFF! 初心者やエキスパートトレーダーのためのベストソリューション! このダッシュボードソフトウェアは、28の通貨ペアで動作しています。それは私達の主要な指標(高度な通貨の強さ28と高度な通貨インパルス)の2に基づいています。それは全体の外国為替市場の大きい概観を与えます。それは、すべての(9)時間枠で28の外国為替ペアのための高度な通貨の強さの値、通貨の動きの速度と信号を示しています。チャート上で1つのインディケータを使用して市場全体を観察し、トレンドやスキャルピングの機会をピンポイントで見つけることができたら、あなたのトレードがどのように改善されるか想像してみてください。 このインディケータには、強い通貨と弱い通貨の識別、潜在的な取引の識別と確認がより簡単になるような機能が搭載されています。このインディケータは、通貨の強さや弱さが増加しているか減少しているか、また、すべての時間枠でどのように機能しているかをグラフィカルに表示します。 新機能として、現在の市場環境の変化に適応するダイナミックなマーケットフィボナッチレベルが追加され、すでに当社のAdvan
TPSpro TRENDPRO  - is a trend indicator that automatically analyzes the market and provides information about the trend and each of its changes, as well as giving signals for entering trades without redrawing! The indicator uses each candle, analyzing them separately. referring to different impulses - up or down impulse. Exact entry points into transactions for currencies, crypto, metals, stocks, indices!  -  Version MT5               DETAILED DESCRIPTION                R ecommended to use with
Enigmera
Ivan Stefanov
5 (3)
エニグメラ:市場の中核 https://www.enigmera.com はじめに このインディケータと取引システムは、金融市場に対する驚くべきアプローチです。ENIGMERAは、フラクタルサイクルを使用して、サポートとレジスタンスレベルを正確に計算します。本格的な蓄積局面を示し、方向性と目標を示します。 トレンド中でも調整中でも機能するシステムです。 どのように作動するのか? ENIGMERAは、支持線・抵抗線、目標線、乖離線の3つのラインで構成されています。このシステムは、過去のデータを現在と未来に外挿する典型的な市場指標とは異なり、現在の完全な画像を提供します。支持線上にある場合、それは本当の支持を意味し、抵抗線上にある場合、それは本当の抵抗を意味する。ある水準が破られた場合、それはトレンドの変化を意味する。再描画はしない。 市場は常に進化しているため、ENIGMERAはその評価ツールを適応させ、定期的に戦略を修正しています。  これにより、すべてのシナリオが徹底的に評価されることが保証されます。この市場指標の独自性は、その能力を見れば明らかです。  ENIGM
Trend Screener
STE S.S.COMPANY
4.83 (88)
トレンドインジケーター、1つのツールに組み込まれたすべての重要なトレンド機能を備えたトレンドトレーディングとフィルタリングのための画期的なユニークなソリューション! これは、すべてのシンボル/商品(外国為替、商品、暗号通貨、インデックス、株式)で使用できる100%再描画されていないマルチタイムフレームおよびマルチ通貨インジケーターです。 トレンドスクリーナーは、チャート内のドットで矢印トレンドシグナルを提供するインジケーターに続く効率的なインジケーターです。 トレンド分析インジケーターで使用できる機能: 1.トレンドスキャナー。 2.最大利益分析を備えたトレンドライン。 3.トレンド通貨強度メーター。 4.アラート付きのトレンド反転ドット。 5.アラート付きの強いトレンドドット。 6.トレンド矢印 毎日の分析例、毎日のシグナルパフォーマンス...など、トレンドスクリーナーインジケーターを使用して、ここで見つけることができます: ここをクリックしてください 期間限定オファー:トレンドスクリーナーインジケーターは、50ドルと生涯でのみご利用いただけます。 (元の価格125 $) MQ
ご紹介   クォンタム トレンド スナイパー インジケーターは 、トレンド反転を特定して取引する方法を変革する画期的な MQL5 インジケーターです。 13年以上の取引経験を持つ経験豊富なトレーダーのチームによって開発されました。     クォンタムトレンドスナイパーインジケーター   は、非常に高い精度でトレンドの反転を識別する革新的な方法で、あなたのトレーディングの旅を新たな高みに押し上げるように設計されています。 ***Quantum Trend Sniper Indicatorを購入すると、Quantum Breakout Indicatorを無料で入手できます!*** クォンタム ブレイクアウト インジケーターは、トレンドの反転を特定するとアラートを発し、矢印を示し、3 つのテイクプロフィットレベルを提案します。 初心者トレーダーにもプロのトレーダーにも適しています。 量子EAチャネル:       ここをクリック MT5のバージョン:       ここをクリック 推奨事項: 期間: すべての時間枠。最良の結果を得るには、
FX Volume
Daniel Stein
4.6 (35)
mql5と Telegramの モーニング・ブリーフィングで、詳細とスクリーンショットを含む毎日のマーケット・アップデートをご覧 ください! FX Volumeは、ブローカーの視点から市場のセンチメントをリアルに洞察する、最初で唯一の出来高インジケーターです。 ブローカーのような機関投資家が外国為替市場でどのようなポジションをとっているか、COTレポートよりもはるかに速く、素晴らしい洞察を提供します。 この情報をチャート上で直接見ることは、あなたの取引にとって真のゲームチェンジャーであり、画期的なソリューションです。 以下のようなユニークなマーケットデータ洞察から利益を得てください。 比率は 、通貨のロングポジションとショートポジションの比率をパーセントで表示します。 比率の変化は 、選択した期間内のロング比率とその変化率を表示します。 Volumes Totalは 、通貨の取引量(ロングとショート)の合計をロット単位で表示します。 Volumes Long :全通貨のロングポジションの取引量を表示します。 Volumes(ショート )は、全通貨のショートポジションの取引量を表示
ご紹介     Quantum Breakout PRO は 、ブレイクアウト ゾーンの取引方法を変革する画期的な MQL5 インジケーターです。 13年以上の取引経験を持つ経験豊富なトレーダーのチームによって開発された Quantum Breakout PROは 、革新的でダイナミックなブレイクアウトゾーン戦略により、あなたの取引の旅を新たな高みに押し上げるように設計されています。 クォンタム ブレイクアウト インジケーターは、5 つの利益ターゲット ゾーンを備えたブレイクアウト ゾーン上のシグナル矢印と、ブレイクアウト ボックスに基づいたストップロスの提案を提供します。 初心者トレーダーにもプロのトレーダーにも適しています。 量子EAチャネル:       ここをクリック MT5バージョン:   ここをクリック 重要!購入後、インストールマニュアルを受け取るためにプライベートメッセージを送ってください。 推奨事項: 時間枠: M15 通貨ペア: GBPJPY、EURJPY、USDJPY、NZDUSD、XAUUSD アカウントの種類: ECN、Raw、また
Indicator : RealValueIndicator Description : RealValueIndicator is a powerful tool designed specifically for trading on the EURUSD pair. This indicator analyzes all EUR and USD pairs, calculates their real currency strength values, and displays them as a single realistic value to give you a head start on price. This indicator will tell you moves before they happen if you use it right. RealValueIndicator allows you to get a quick and accurate overview of the EURUSD currency pair tops and bottoms,
Thise indicator is up down v6  comes with tradingwiev pinescript. purchased people, after installed on terminal ,contact me on mql5  to get BONUS  TradingView pinescript. up-down indicator is no repaint and works all pairs and lower than weekly time frames charts. it is suitable also 1 m charts for all pairs. and hold long way to signal. dont gives too many signals. when red histogram cross trigger line that is up signal.and price probably will down when blue histogram cross trigger line that
ECM Elite Channel is a volatility-based indicator, developed with a specific time algorithm, which consists of finding possible corrections in the market. This indicator shows two outer lines, an inner line (retracement line) and an arrow sign, where the channel theory is to help identify overbought and oversold conditions in the market. The market price will generally fall between the boundaries of the channel. If prices touch or move outside the channel, it's a trading opportunity. The
Gold Channel is a volatility-based indicator, developed with a specific timing algorithm for the XAUUSD pair, which consists of finding possible corrections in the market. This indicator shows two outer lines, an inner line (retracement line) and an arrow sign, where the theory of the channel is to help identify overbought and oversold conditions in the market. The market price will generally fall between the boundaries of the channel. If prices touch or move outside the channel it is a tra
Gann Signal is a very simple indicator at first glance, but hidden inside is many years of experience in studying W.D.Ganna methods. The indicator gives accurate BUY/SELL signals, without redrawing. The indicator is very easy to use. All you need to do is attach it to your chart and follow its recommendations. The indicator constantly analyzes the market for entry opportunities. When such an opportunity appears, the indicator gives a signal in the form of an arrow. I repeat, all signals are NOT
Please send me Direct message on MQL5 CHAT after purchasing the Indicator for Training and Installation Support There are some additional files that is important to use with the Indicator . So be sure to contact me after purchasing the Indicator So that I can add you for training and support . If you find any difficulty with installation then send me Direct message here So that I can connect with you via Anydesk or Teamview for the product installation. " Smart Order Block Indicator " to find
Introduction to X3 Chart Pattern Scanner X3 Cherart Pattern Scanner is the non-repainting and non-lagging indicator detecting X3 chart patterns including Harmonic pattern, Elliott Wave pattern, X3 patterns, and Japanese Candlestick patterns. Historical patterns match with signal patterns. Hence, you can readily develop the solid trading strategy in your chart. More importantly, this superb pattern scanner can detect the optimal pattern of its kind. In addition, you can switch on and off individu
現在20%OFF! 初心者やエキスパートトレーダーに最適なソリューションです。 このインディケータは、エキゾチックペア・コモディティ・インデックス・先物など、あらゆるシンボルの通貨の強さを表示することに特化したインディケータです。金、銀、原油、DAX、US30、MXN、TRY、CNHなどの通貨の強さを表示するために、9行目にどのシンボルでも追加することができます。独自の機能を多数搭載し、新しい計算式を採用したため、ユニークで高品質、かつ手頃な価格のトレーディングツールとなっています。新しいトレンドやスキャルピングチャンスのトリガーポイントを正確に把握することができるため、あなたのトレードがどのように改善されるか想像してみてください。 ユーザーマニュアル:ここをクリック   https://www.mql5.com/en/blogs/post/708876 すべての時間枠に対応します。あなたはすぐにトレンドを見ることができるようになります! 新しいアルゴリズムに基づいて設計されているため、潜在的な取引の特定と確認がより簡単になります。これは、8つの主要通貨と1つのシンボ
TrendMaestro
Stefano Frisetti
5 (3)
note: this indicator is for METATRADER4, if you want the version for METATRADER5 this is the link:  https://www.mql5.com/it/market/product/108106 TRENDMAESTRO ver 2.4 TRENDMAESTRO recognizes a new TREND in the bud, he never makes mistakes. The certainty of identifying a new TREND is priceless. DESCRIPTION TRENDMAESTRO identifies a new TREND in the bud, this indicator examines the volatility, volumes and momentum to identify the moment in which there is an explosion of one or more of these data a
norepaint buy sell indicator is norepaint indicator.and works all pairs and all timeframes. using is wery simple ,it puts arrow on price probably buy sell arrows. thise indicator is suitable for beginner and experienced traders. there is cnt numbers that show how many bars you see the signal back. increasing it possible but up to chart have the how many bars . minimum value of this 500.
SNR LEVEL INDICATOR Accurate Snr level indicator will only display Fresh Levels that are close to the Current Market Price. This indicator is very accurate in mapping Support & resistance levels. there is an alert feature when the price TOUCHES the SNR LEVEL, WHEN CLOSE CANDLE BREAK/REJECT SNR LEVEL. INDICATOR MARKING :: - SUPPORT LEVEL == V SHAPE - RESISTANCE LEVEL == APEX LEVEL - GAP RESISTANCE & GAP SUPPORT == OPEN CLOSE CANDLE - SUPPORT BECAME RESISTANCE & RESISTANCE BECAME SUPPORT INDIC
このインディケータは、当社の2つの製品 Advanced Currency IMPULSE with ALERT  +   Currency Strength Exotics . のスーパーコンビネーションです。 このインジケーターは全ての時間枠で作動し、8つの主要通貨と1つのシンボルの強弱のインパルスをグラフで表示します。 このインジケータは、金、エキゾチックペア、商品、インデックス、先物など、あらゆるシンボルの通貨強度の加速度を表示することに特化されています。金、銀、原油、DAX、US30、MXN、TRY、CNHなどの通貨強度の加速度(インパルスまたは速度)を表示するために、任意のシンボルを9行目に追加できる、この種の最初のものです。 新しいアルゴリズムに基づいて構築され、潜在的な取引の特定と確認がさらに容易になりました。これは、通貨の強さや弱さが加速しているかどうかをグラフィカルに表示し、その加速の速度を測定するためです。加速すると物事は明らかに速く進みますが、これはFX市場でも同じです。つまり、反対方向に加速している通貨をペアリングすれば、潜在的に利益を生む取
The All-in-One Trade Indicator (AOTI) determines daily targets for EURUSD, EURJPY, GBPUSD, USDCHF, EURGBP, EURCAD, EURAUD, AUDJPY, GBPAUD, GBPCAD, GBPCHF, GBPJPY, AUDUSD, and USDJPY. All other modules work with any trading instruments. The indicator includes various features, such as Double Channel trend direction, Price channel, MA Bands, Fibo levels, Climax Bar detection, and others. The AOTI indicator is based on several trading strategies, and created to simplify market analysis. All-in-One
"The Squeeze indicator attempts to identify periods of consolidation in a market. In general the market is either in a period of quiet consolidation or vertical price discovery. By identifying these calm periods, we have a better opportunity of getting into trades with the potential for larger moves. Once a market enters into a "squeeze," we watch the overall market momentum to help forecast the market direction and await a release of market energy." Modified TTM Squeeze Indicator is a modifica
これはMT4のインジケーターで、再描画なしで取引に参入するための正確なシグナルを提供します。 外国為替、暗号通貨、金属、株式、インデックスなど、あらゆる金融資産に適用できます。かなり正確な見積もりを提供し、取引を開始して終了するのに最適な時期を教えてくれます。1つのシグナルを処理しただけでインジケーターの元が取れた例の 動画 (6:22)をご覧ください。Entry PointsPro インジケーターの助けを借りたほとんどのトレーダーの最初の1週間の結果が改善しています。 Telegramグループ に登録してください。Entry Points Proインジケーターのメリットは次の通りです。 再描画のないエントリーシグナル 再描画されるインジケーターでは一度表示されたシグナルが削除されて大きな金銭的損失につながることがありますが、これと異なり、表示されて確認されたシグナルは消えることがありません。 エラーなしの取引開始 インジケーターアルゴリズムによって取引を開始する(資産を売買する)理想的な瞬間を見つけることができます。それを使用するすべてのトレーダーの成功率が向上します。
もちろんです。以下は、提供いただいたテキストの日本語への翻訳です: MT4用の天文学指標をご紹介します:究極の天体トレーディングコンパニオン トレーディング体験を天空の高みに高める準備はできていますか?私たちの革命的なMT4用の天文学指標をご紹介します。この革新的なツールは、複雑なアルゴリズムの力を借りて、類まれなる天文学的洞察と精密な計算を提供します。 あなたの指先で宇宙の情報を: 宝のような天文学的データが明らかになる包括的なパネルをご覧ください。惑星の地理的/太陽中心座標、太陽と地球の距離、星の大きさ、伸び、星座、黄道座標および赤道座標、さらには水平座標まで、それぞれが綿密に計算され美しく表示されています。指標によって生成される垂直線は時間値に対応し、トレーディングの旅に宇宙の視点を提供します。 惑星のラインと関係: グラフを飾る惑星のラインの魔法を体験し、スケールと角度をカスタマイズできます。直感的なコントロールパネルを介して各惑星のラインの表示を簡単に切り替えることができます。指定された時刻範囲内での合会、六分会、四分会、三分会、対会、逆行の指標で天体の関係の芸術を発見してく
Ace Supply Demand Zone Indicator The concept of supply demand relies on the quantity mismatching between buying and selling volumes in the financial market. Supply and demand zone can provide the good entry and exit. A zone is easier to trade than a line. The supply demand zone can provide the detailed trading plan and the risk management. Its ability to predict market direction is high. There are two distinctive points about Ace Supply Demand Zone Indicator. Ace Supply Demand Zone indicator was
収益性の高い取引機会を簡単に特定するのに役立つ強力な外国為替取引インジケーターをお探しですか?ビースト スーパー シグナル以外に探す必要はありません。 この使いやすいトレンドベースのインジケーターは、市場の状況を継続的に監視し、新しいトレンドを検索したり、既存のトレンドに飛びついたりします。ビースト スーパー シグナルは、すべての内部戦略が一致し、互いに 100% 合流したときに売買シグナルを発するため、追加の確認は不要です。シグナル矢印アラートを受け取ったら、単に売買します。 購入後、プライベート VIP グループに追加されるようにメッセージを送ってください! (完全な製品購入のみ)。 購入後、最新の最適化されたセット ファイルについてメッセージを送ってください。 MT5バージョンは こちらから入手できます。 Beast Super Signal EA は こちらから 入手できます。 コメント セクションをチェックして、最新の結果を確認してください。 ビースト スーパー シグナルは、1:1、1:2、または 1:3 のリスクと報酬の比率に基づいて、エントリ
Tradeable Changer Indie
Opengates Success International
Tradeable Changer Indie Trade-able Changer Indie is an indicator that serves several purposes. The idea behind this operating indicator is to have a minimal set of indicator or experts on the chart in order to avoid clumsy chart window and at the same time have a great time trading profitably. This is a combination of Symbol/Time-frame Changer and a Trading system based on Trends following. It has a small board to display trade signals for the trader. Due to the nature of these com
Volatility Trend System - a trading system that gives signals for entries. The volatility system gives linear and point signals in the direction of the trend, as well as signals to exit it, without redrawing and delays. The trend indicator monitors the direction of the medium-term trend, shows the direction and its change. The signal indicator is based on changes in volatility and shows market entries. The indicator is equipped with several types of alerts. Can be applied to various trading
作者のその他のプロダクト
Советник для ручного построения трендовых линий и сопутствующих им стоплоссам и тейкпрофитам. После построения, советник запоминает уровни, направление и лот. При касании текущей цены с расчетной ценой, открывается ордер с заранее выбранными параметрами. Возможно построение и запоминание до 10 разнонаправленных уровней с разных таймфреймов. Можно использовать на любом торговом инструменте. Корректно работает с 4 и 5-значными ценами.
FREE
専門家のアドバイザーマニュアル工事の傾向線に伴う損益は、受益となりました。 ビルド後、EAはレベル、方向、およびロットを記憶します。 計算された価格で現在の価格をタッチすると、事前に選択されたパラメータを持つ注文が開かれます。 異なる時間枠から最大10の多方向レベルを構築して保存することができます。 あなたは、任意の取引商品でそれを使用することができ これは、4桁と5桁の価格で正しく動作します。 あなたは、取引チャネルの内訳とそれからのリバウンドの両方のいくつかの取引ラインから取引戦略を作成することができます。 市場価格がそれに触れていない場合は、取引ラインのすべての設定が削除される期間を設定することができます。 トレンド目標の計算の便宜のために、設定レベルを備えた組み込みのFiboルーラーがありますが、イベント処理の特殊性のために、この関数はテスト中に
フィルタ:
レビューなし
レビューに返信