RSI 4x Candles AM
- インディケータ
- Andriy Matviyevs'kyy
- バージョン: 27.0
- アップデート済み: 12 9月 2024
- アクティベーション: 10
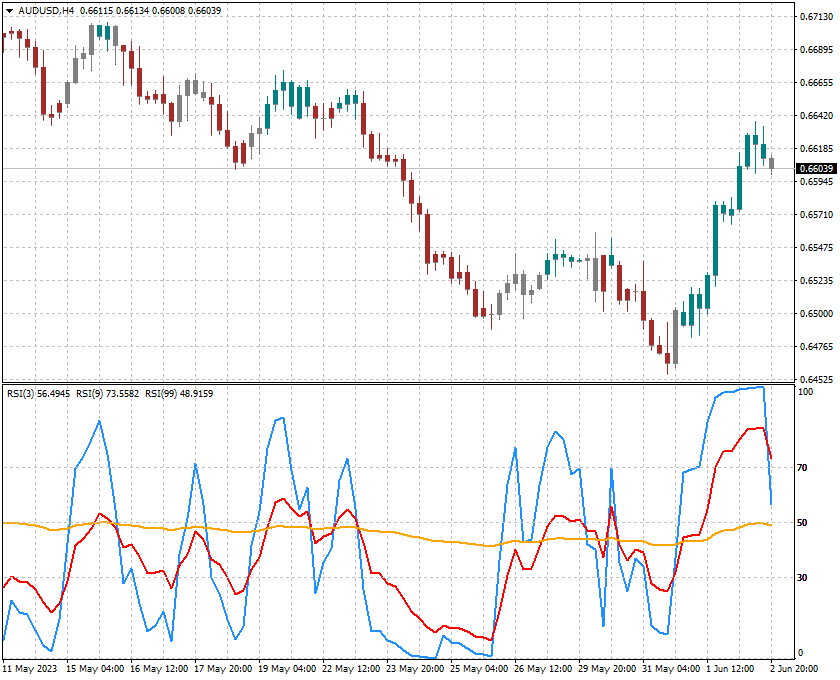
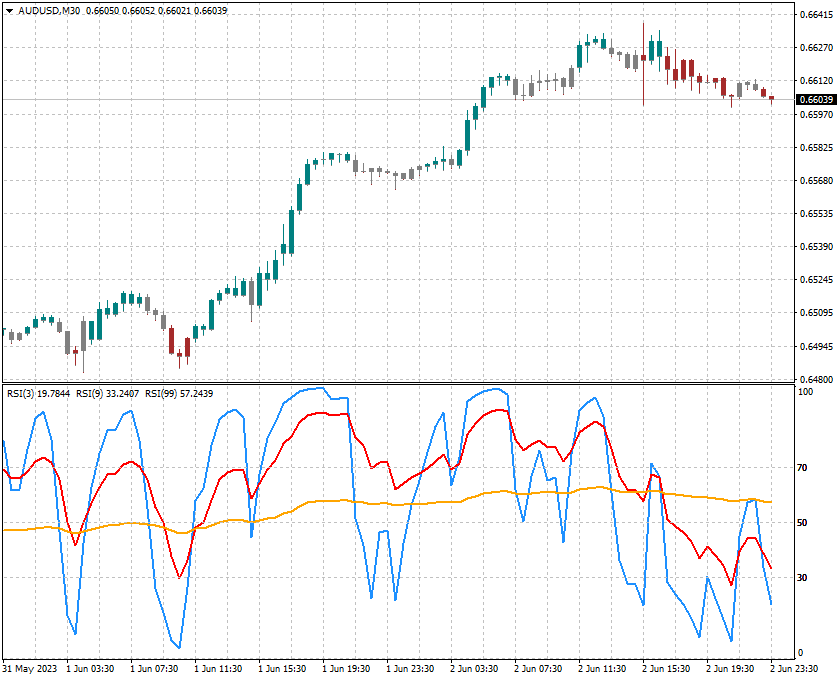
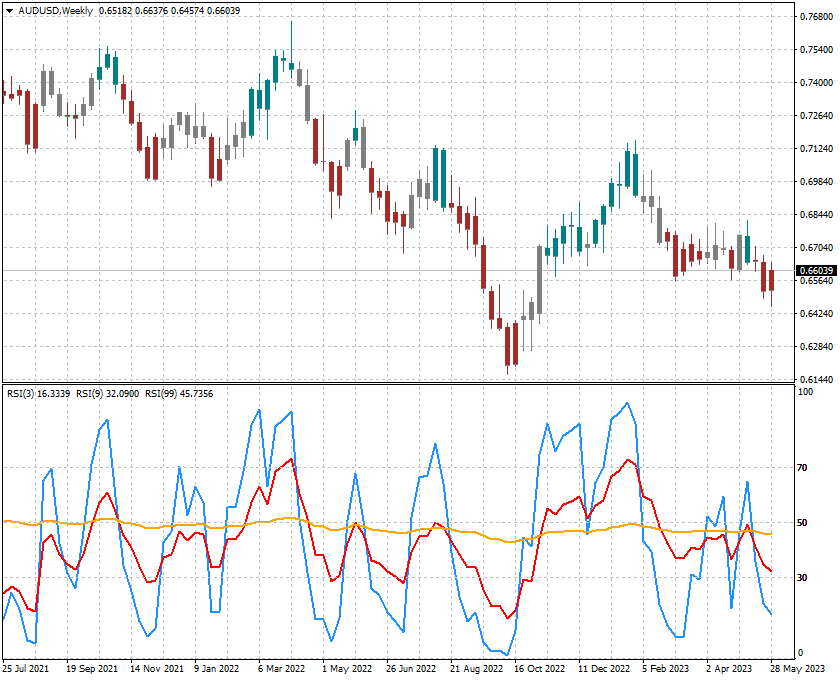
The presented indicator displays in the form of colored candles the signals of the intersections of four RSI indicators of different periods.
The candle turns red when the values of the first indicator are less than the values of the second indicator and the values of the third indicator are less than the values of the fourth indicator.
The candle turns blue when the values of the first indicator are greater than the values of the second indicator and the values of the third indicator are greater than the values of the fourth indicator.
In other cases, the candles are colored grey.
Application rules:
- The appearance of the first candle colored red is a sell signal.
- The appearance of the first candle colored in blue is a buy signal.
- The appearance of the first gray candle signals a possible change in the direction of price movement and pulling up Stop Loss levels.
The indicator is designed for trading pending orders.
The confirmation of the signal is the overcoming by the price of the high/low of the bar on which the signal was given.
Settings:
- RSI1_period (>1) - period of the first RSI;
- RSI1_price - price of the first RSI;
- RSI2_period (>RSI1_period) - second RSI period;
- RSI2_price - price of the second RSI;
- RSI3_period (>1) - period of the third RSI;
- RSI3_price - price of the third RSI;
- RSI4_period (>RSI3_period) - period of the fourth RSI;
- RSI4_price - price of the fourth RSI.
ユーザーは評価に対して何もコメントを残しませんでした