Breakout Lines MT5
- インディケータ
- Carl Gustav Johan Ekstrom
- バージョン: 1.10
- アップデート済み: 19 4月 2024
- アクティベーション: 20
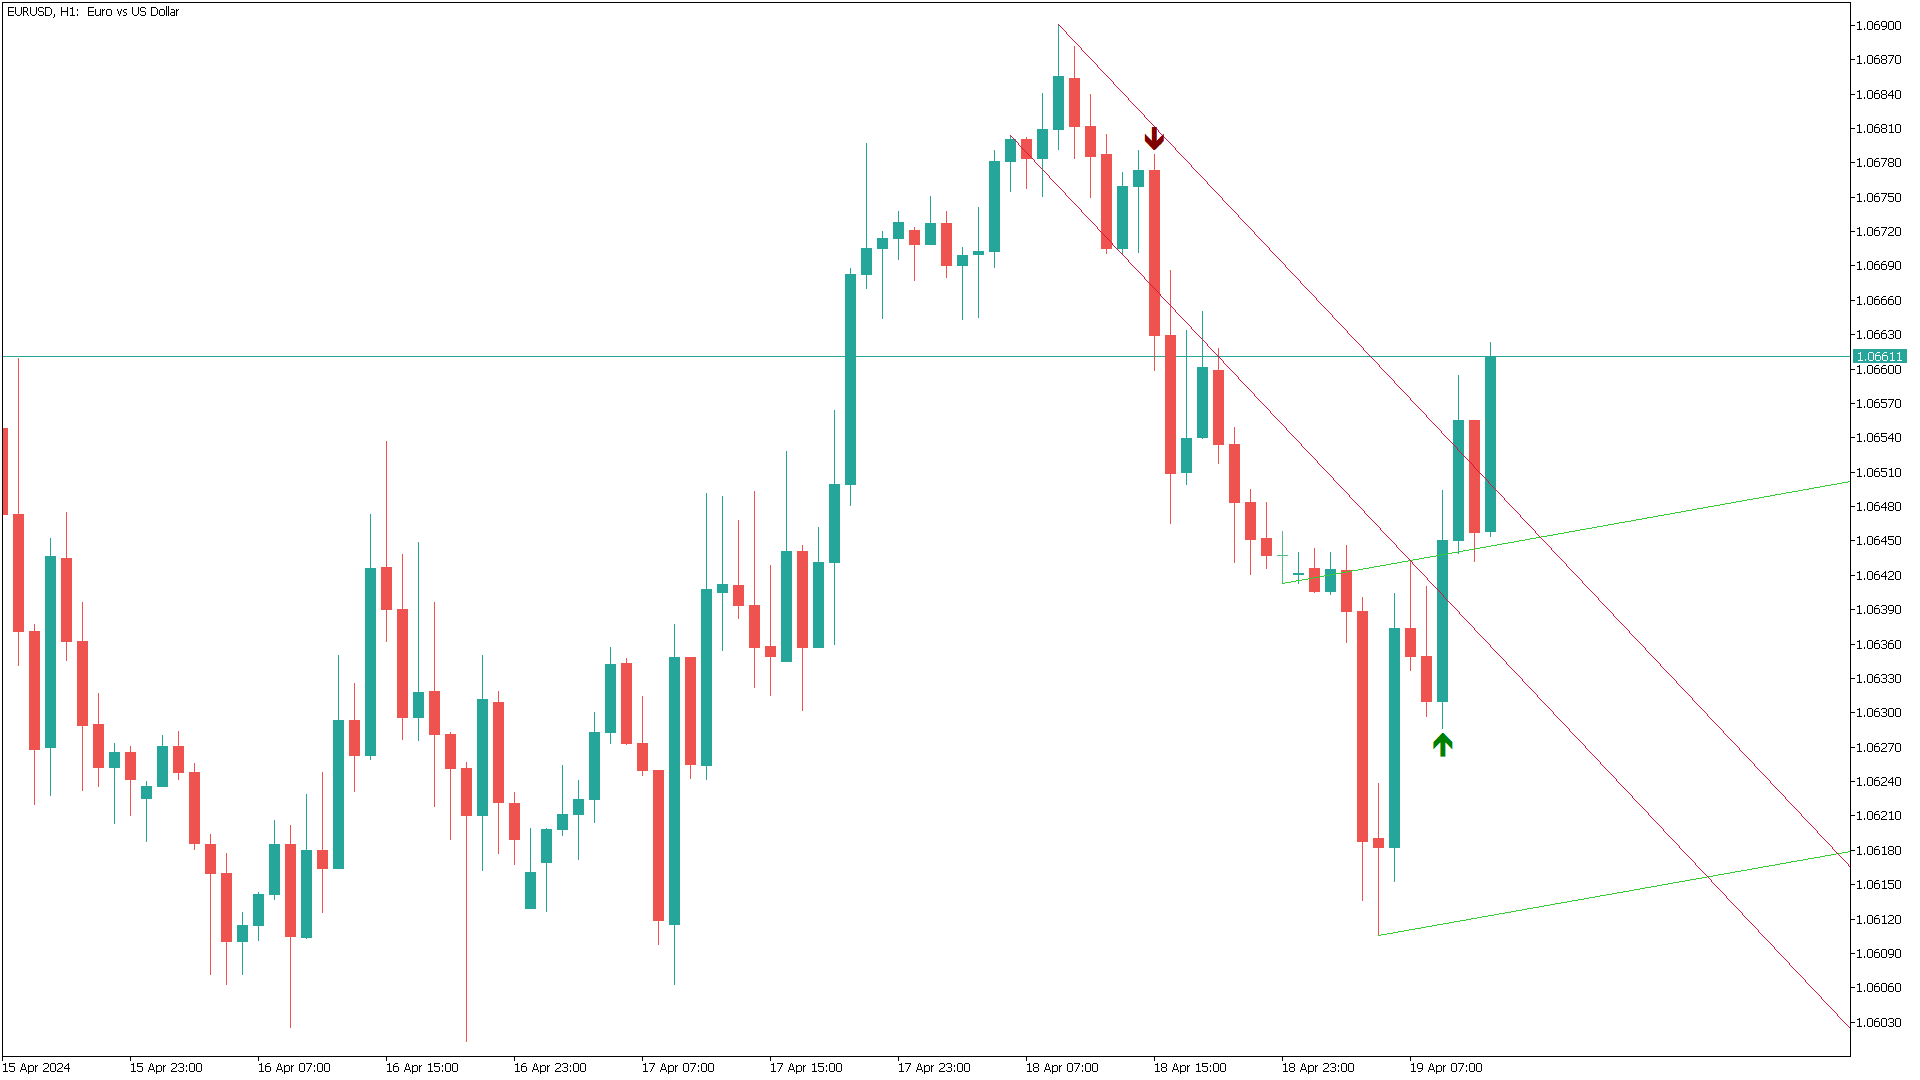
The Breakout Line in technical analysis serves as a crucial tool for understanding market dynamics and potential shifts in price direction. It's designed to highlight rapid accelerations or declines in the market's trajectory.
-
Unconventional Analysis: The Breakout Line is not your typical technical indicator; it's tailored to capture swift market movements, offering a unique perspective on price trends.
-
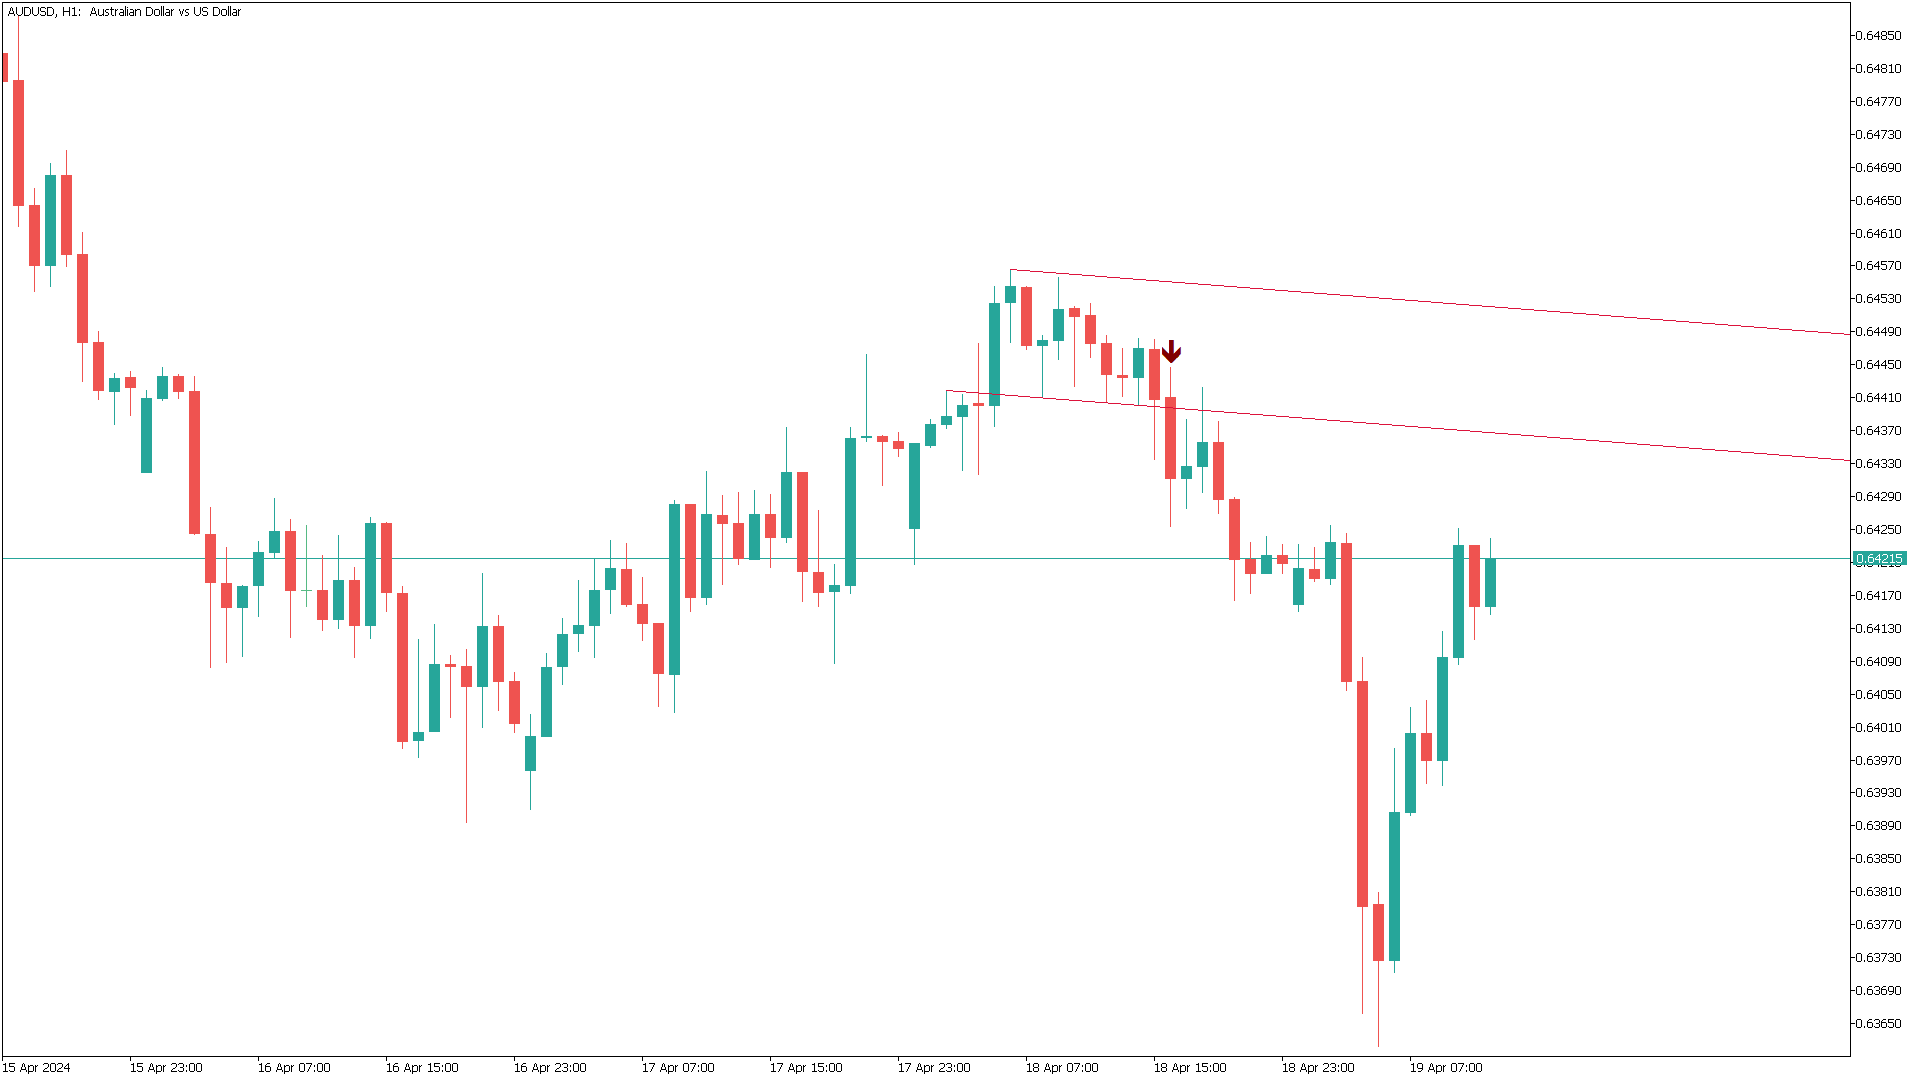
Angle of the Breakout Line: The sharper the angle formed by the Breakout Line, the stronger the indication of rapid market movements in that direction. This suggests that a steep incline or decline in the Breakout Line reflects a high potential for the market to rally or decline swiftly in the corresponding direction.
-
Cyclical Boundaries: The Breakout Line delineates the cyclical boundaries of price movements, indicating critical pressure points in the market. When the price approaches or breaks through this line, it signifies a pivotal moment where significant market shifts could occur.
-
Breaking the Line: As implied by its name, breaking the Breakout Line suggests a high likelihood of rapid market movements. This breach indicates a potential turning point in the market's trajectory, with increased momentum towards the direction of the breakout.
In summary, the Breakout Line provides traders and analysts with insights into market dynamics, offering cues about potential rapid movements and critical points of price pressure.
Parameters
- Count Of Candles After Line Formation: 20 (increase this value if you want to receive signals past 20 candles after the creation of the breakout line. However this is not recommended as it can be considered "late" in the trend. The most powerful signals are generated within the first 20 candles!
- Sound Alert: On/Off (triggers sound alert on new signal)
- Sound File Name: alert.wav
- Mobile Push Notification: True/False
- Send Email Notification: True/False
- Pop-Up Alert: True/False
- Bullish Line Color: LimeGreen
- Bearish Line Color: Crimson
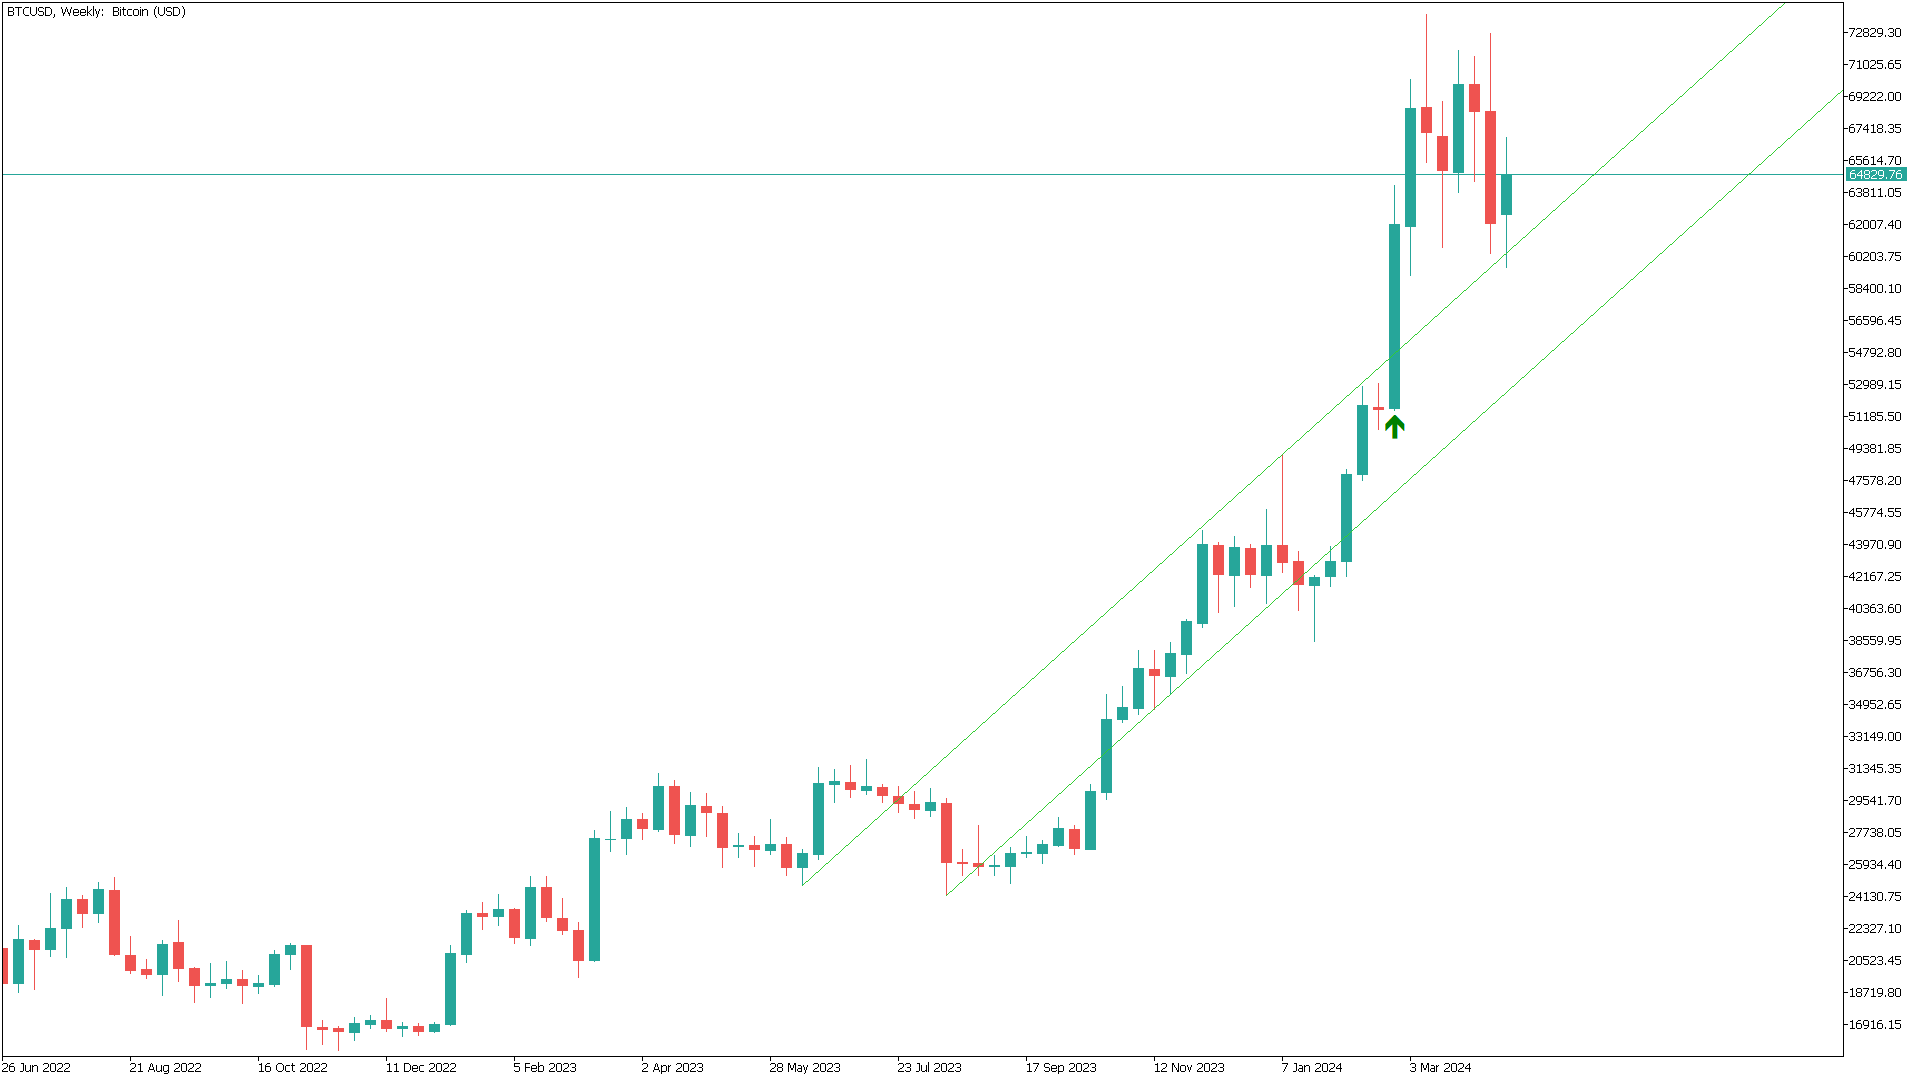
Invaluable tool in deciphering not only where price is heading to short term, but also where market is going as a whole (especially if you pair it with multiple timeframes). It is way more than it looks. When you grow your understanding of market cycles and Martin Armstrong's technical analysis, this will be a gem. (I recommend pairing it with his Trap Play indicator as it will help with finding perfect entry)