Versus USD MT5
- インディケータ
- Vonjinirina Alfred Randrianiaina
- バージョン: 1.10
- アップデート済み: 5 5月 2023
- アクティベーション: 10
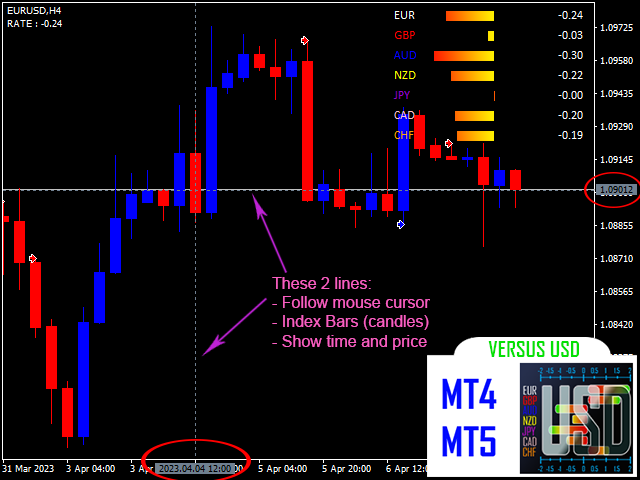
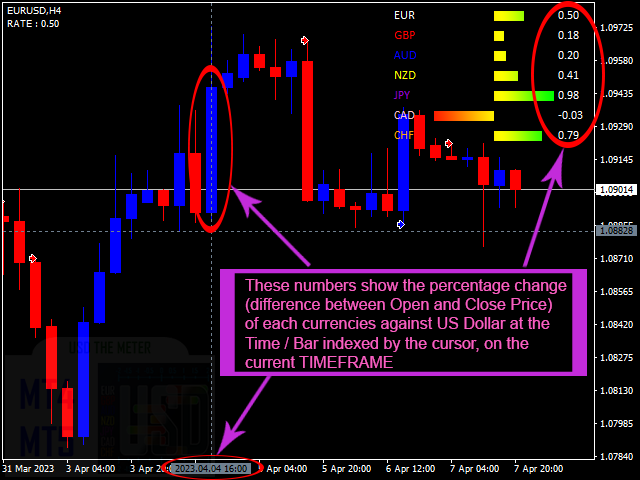
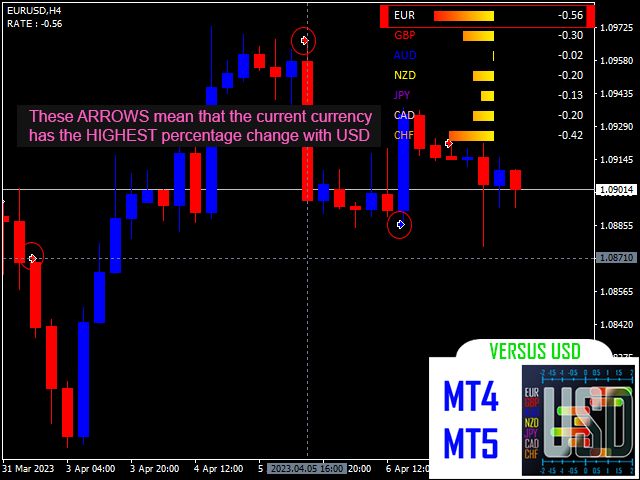
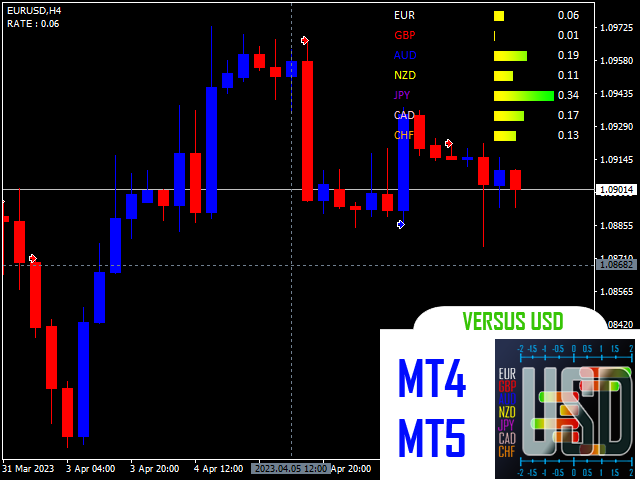
「Versus USD(米ドルに対する)」は、主要通貨それぞれの価格変動を米ドルに対して計算し、グラフの現在の時間枠における各期間またはバーについて、そのパフォーマンスを比較的明確に表示します。加えて、「進捗バー」を使用して表示し、他の通貨と比較した際にその通貨が最も高いまたは最も低い変動率を経験したバー/期間には「矢印」を表示し、通貨のパフォーマンスをより正確に測定することができます。
米ドルは、外国為替市場における各主要通貨のパフォーマンスを測定するために使用される主要通貨であり、国際取引において最も流動性が高く広く使用されている通貨です。加えて、ほとんどの外国為替取引は米ドルをベース通貨またはクオート通貨として使用しているため、他の通貨のパフォーマンスを比較・評価することが容易になります。
外国為替取引における経験レベルや取引スタイルに関わらず、既に収益性の高いストラテジーを持っているかどうかに関わらず、このインジケーターは短時間でスキルアップすることができます。また、以下の機能を備えた使いやすいインジケーターです:
- 28の主要通貨ペアすべてに対応しています
- すべての時間枠(M1-MN)で動作します
- 設定する必要がなく、すべてが自動化されています
- MT4およびMT5で利用可能です
前提条件:
1. インジケーターを正しく使用するためには、7つの主要通貨ペアの過去データを同期し、更新する必要があります。これらのペアのうちの1つを使用していなくても、これらのペアのチャートを開くことをお勧めします。
これらの7つの主要通貨ペアは以下のとおりです:
- EURUSD
- GBPUSD
- AUDUSD
- NZDUSD
- USDJPY
- USDCAD
- USDCHF
2. インジケーターで使用する他のシンボルの過去データも、これらの7つの主要通貨ペアの過去データと同期して最新のものであることが重要です。
お勧め:
- このインジケーターは、JPYを含む通貨ペアと一緒に使用することを強くお勧めします。JPYを含む通貨ペアと一緒に使用する場合、このインジケーターはより信頼性が高く、正確な結果を示すことができます。
- インジケーターをチャートに追加する前に、USDを含む7つの主要通貨ペアの歴史的なデータと、インジケーターを使用する通貨ペアのデータが最新で同期されていることを確認することをお勧めします。これにより、潜在的なバグを回避できます。
- もしインジケーターにバグが発生した場合は、別の時間枠に切り替えた後、再び望む時間枠に戻すことをお勧めします。
全体的に、このインジケーターは外国為替取引において優れたツールであり、前例のない機能を提供しています。私たちは、あなたのご使用に関するフィードバックを非常に歓迎します。
Join the Versus USD chat if you have questions or reports or something else about the indicator.
Versus USD MT4 : https://www.mql5.com/fr/market/product/97127