• 概要
  • レビュー (2)
  • コメント
  • 最新情報

ICT Breakers Multi TF MT4

5

[MT5 Version] [Order Blocks] [Kill Zones] [SMT Divergences]

How to trade using Order BlocksClick here

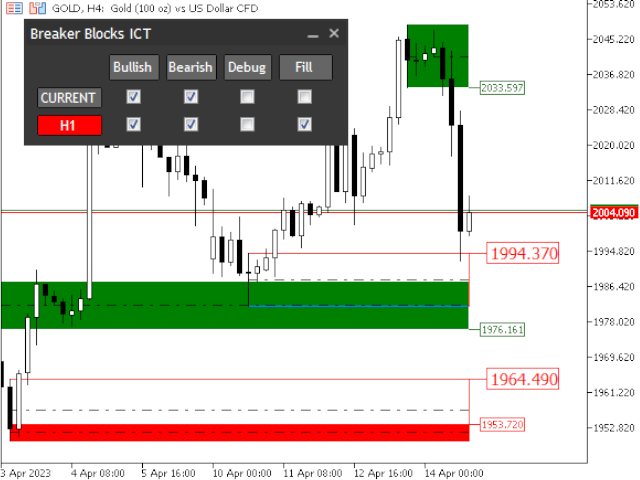
User Interface Performance: During testing in the strategy tester, the UI may experience lag. Rest assured, this issue is specific to the testing environment and does not affect the indicator's performance in live trading.

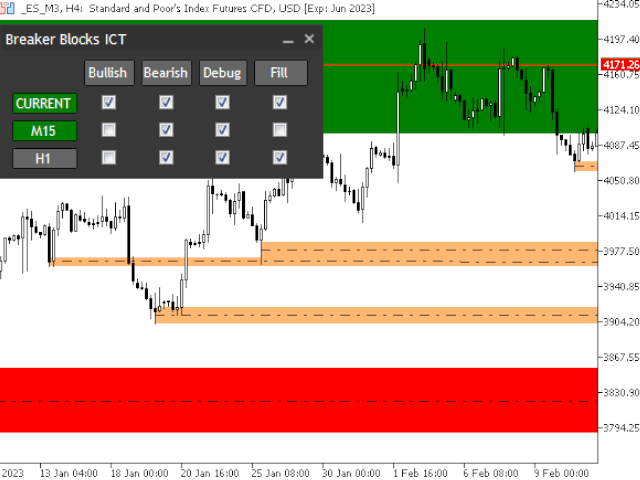
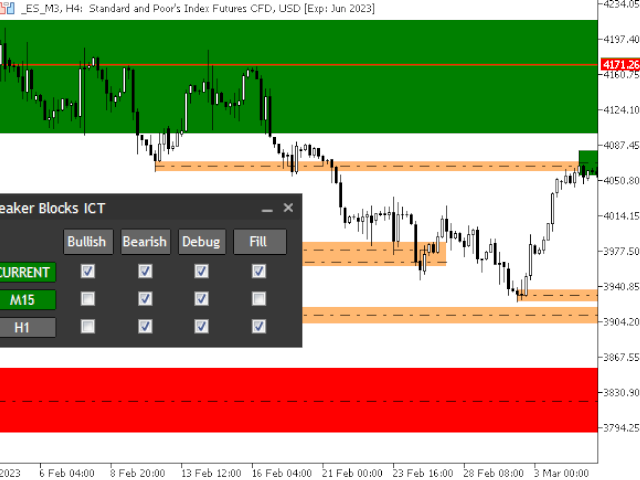
Elevate your trading strategy with the Order Blocks ICT Multi TF indicator, a cutting-edge tool designed to enhance your trading decisions through advanced order block analysis. Order blocks represent pivotal levels where institutional traders historically placed significant orders, often signaling strong support or resistance zones and potential trend reversals or continuations.

Why Choose Order Blocks ICT Multi TF?

Comprehensive Market Insight:

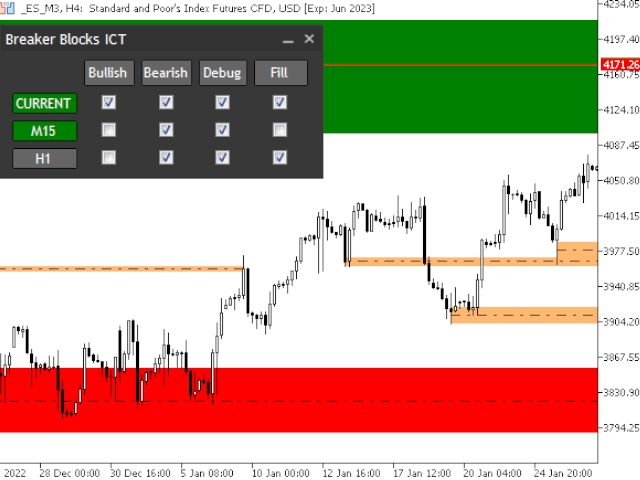
  • Multi-Timeframe Analysis: Identify order blocks across multiple timeframes simultaneously, providing a holistic view of market trends and enhancing decision-making accuracy.

Efficiency and Customization:

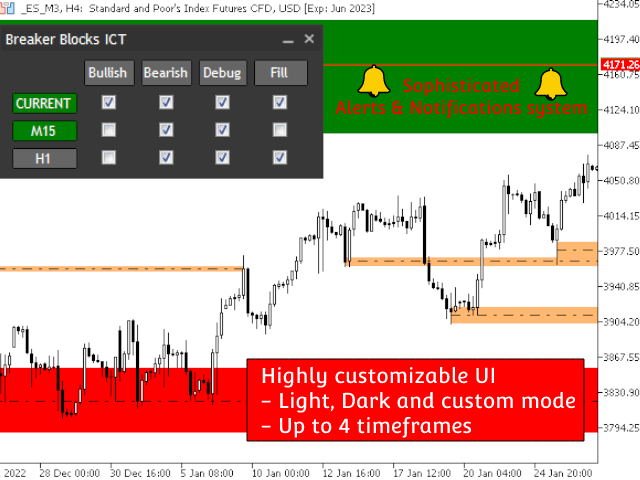
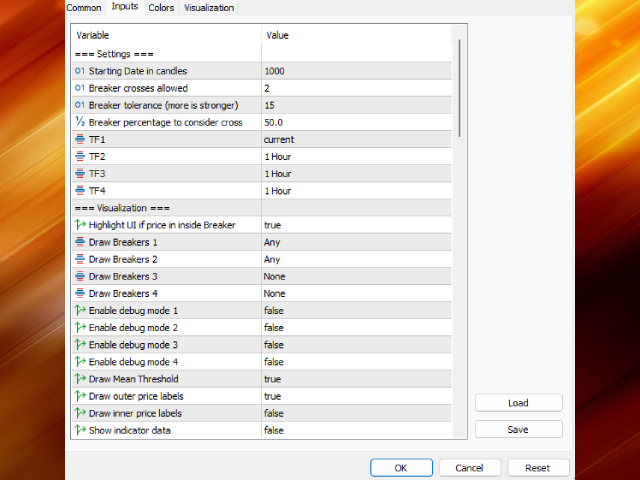
  • User-Friendly Interface: Intuitive design with customizable settings tailored to your trading style and preferences.
  • Versatility: Suitable for all trading levels and adaptable to various trading instruments including Cryptos, Forex, Stocks, Indices, and Commodities.

Sophisticated Trading Tools:

  • Sophisticated Alerts: Stay informed with customizable alerts and notifications, ensuring you never miss crucial market opportunities based on order block analysis.
レビュー 2
Junaid Munawar
971
Junaid Munawar 2023.04.19 19:24 
 

Very interesting indicator always like it author improving UI which help a lot.

おすすめのプロダクト
Black series MT4 - The indicator is designed for trading on binary options with Timeframe M1-M5-M15 Multicurrency (Works on cryptocurrency and currency pairs) The signal appears when the candle opens Up to 90% correct signals There is no signal redrawing at all Can be used with other indicators. Good for scalping! In Settings there is: -Indicator working methods -I Allert Arrow color Red signal down Blue signal up Also watch the video how the indicator works and signals
El indicador "MR BEAST PATTERNS WITH ALERTS" es una herramienta avanzada diseñada para identificar y notificar automáticamente patrones de oportunidad en el mercado financiero. Basándose en una combinación de análisis técnico y algoritmos inteligentes, este indicador escanea constantemente el gráfico en busca de patrones específicos que podrían indicar momentos propicios para la toma de decisiones. Características Principales: Detección de Patrones: El indicador identifica patrones de oportunida
This index can be traced back to historical transactions, and can clearly see the trading location, trading type, profit and loss situation, as well as statistical information. Showlabel is used to display statistics. Summy_from is the start time of order statistics. This parameter is based on the opening time of the order. Backtracking can help us to correct the wrong trading habits, which is very important for beginners to learn manual transactions. This index is suitable for each time
ECM Elite Channel is a volatility-based indicator, developed with a specific time algorithm, which consists of finding possible corrections in the market. This indicator shows two outer lines, an inner line (retracement line) and an arrow sign, where the channel theory is to help identify overbought and oversold conditions in the market. The market price will generally fall between the boundaries of the channel. If prices touch or move outside the channel, it's a trading opportunity. The
The presented indicator allows you to determine potential entry points into the market and set protective orders at reasonable levels. This product can be useful for both beginners and experienced traders. The indicator is based on calculation methods proven by time and practicing traders. The indicator is calculated in two stages: At the first stage, linear regression (LR) of the selected price type is determined for a given number of chart periods. At the second stage, the obtained data is p
The indicator of a Professional Trader is an arrow indicator for predicting the direction of price movement. I have been working on this indicator since 2014. You can use this indicator as your main indicator, use its entry signals, and use it as your only indicator to find entry points. About the product: Recommended TF [H4-D1-W1]   . The indicator predicts the direction of the next candle. Fits a variety of tools; Flexibility in settings for different instruments and intervals through the
Gioteen Volatility Index (GVI)   - your ultimate solution to overcoming market unpredictability and maximizing trading opportunities. This revolutionary indicator helps you in lowering your losing trades due to choppy market movements. The GVI is designed to measure market volatility, providing you with valuable insights to identify the most favorable trading prospects. Its intuitive interface consists of a dynamic red line representing the volatility index, accompanied by blue line that indicat
GTAS FibTdi
Riviera Systems
3.2 (5)
GTAS FidTdi is a trend indicator using combination of volatility and potential retracement levels. This indicator was created by Bernard Prats Desclaux, proprietary trader and ex-hedge fund manager, founder of E-Winvest. Description The indicator is represented as a red or green envelope above or under prices. How to use Trend detecting When the envelope is green, the trend is bullish. When it is red, the trend is bearish. Trading Once a trade is opened, GTAS FibTdi shows retracement zones
FREE
The indicator simplifies the decision-making process by recognizing the reversals using the built-in algorithm, and then confirms the signals at the support / resistance levels. In this way, the indicator tracks the market trend with unsurpassed reliability, ignoring the sharp fluctuations in the market and the noise around the average price. The indicator can be used for both small periods and long-term trading. The indicator is not redrawn and not late. 94% of deals are profitable. Take profit
The universal indicator Diamond Grail which received such a name is not so simple! The indicator has been tested for over a year by our experts! One of the best arrow indicators that is perfect for binary options and forex trading, If you trade on binary options, the best ragtime for it is from 3 minutes to a maximum of 5 minutes An arrow appears on the previous candle. If you trade forex, then the opening time from candle to candle Forex result From 40 To 1324 pips! Profitability
The main idea of this indicator is rates analysis and prediction by Fourier transform. The indicator decomposes exchange rates into main harmonics and calculates their product in future. The indicator shows 2 price marks in history, depicting price range in the past, and 2 price marks in future with price movement forecast. Buy or sell decision and take profit size are displayed in a text label in the indicator window. The indicator uses another indicator as an engine for calculations - FreqoMet
指標名:Double Joker 指標の説明: 1、EURUSD、低点差口座に適合する。 2、黄色線と赤線は90+以上の付近に上向きに到達し、同時に90を穿孔し、sell信号である。 3、黄色線と赤線は下に5以下の付近に達し、同時に10を穿孔し、buy信号である。 4、締め止損点を設置しなければならない。 5、M 1とM 5の結合分析はより効果的である。 指標の説明: 1、EURUSD、低点差口座に適合する。 2、黄色線と赤線は90+以上の付近に上向きに到達し、同時に90を穿孔し、sell信号である。 3、黄色線と赤線は下に5以下の付近に達し、同時に10を穿孔し、buy信号である。 4、締め止損点を設置しなければならない。 5、M 1とM 5の結合分析はより効果的である。
Prophet is a trend indicator. Shows the direction of turning points. Can be used with an optimal risk-to-profit ratio. The arrows indicate favorable moments and directions for entering the market. Uses one parameter for setting (adjust from 1 to 3). The probability of a successful trend is very high. In the course of work, the take-profit is much larger than the stop-loss! Works on all currency pairs and on all timeframes.
The Wing Patterns indicator scans for many different kinds of Patterns using an XABCD structure. The term Wing Pattern is used to refer to all types of patterns based on a general XABCD structure, which is plotted in an alternate high-low extreme form. In other words, assume that point X is started at a low point on the chart. The point A is plotted at the next highest point within a certain number of bars. This certain number of bars is called the depth level. In this example, point B would be
RiKen:証明された精度と信頼性でテクニカル分析を革新 RiKenを発見してください、トレーディング経験を変革するよう設計された革新的なテクニカル分析ツールです。このインジケーターは、そのユニークな特徴によって金融市場を再定義し、テクニカル分析の基準を高めます: 70%の印象的な精度 :RiKenは、70%の顕著な精度率で買いと売りのシグナルを提供することで際立っています。この精度は、投資決定を最適化しようとするトレーダーにとって貴重な資産であり、より利益のあるトレーディング操作のための確かな基盤を提供します。 視覚的な矢印による革新的なシグナリング :チャート上の直感的な矢印を通じて、RiKenは理想的なエントリーとエグジットのポイントを明確に示します。この機能は、密集した手動分析の必要性を最小限に抑え、明確さと精度でトレーディング機会を強調します。 再描画なし、偽のシグナルを排除 :根本的に、RiKenは再描画しないように設計されており、提供されるシグナルが確定的で信頼できることを保証します。この特徴は、偽のシグナルに対する懸念を排除し、RiKenのシグナルに基づいたトレーディン
ASR (Accurate Support Resistance) Indicator Uniqe formula behind this indicator makes it one the world's best support resistance indicator. watch the tutorial video It is user-friendly and here are some key features : -- different calculations for swing traders and scalpers. -- the lower the accuracy number the further the lines distance is. --easily applicable on all charts. ( try to find the best accuracy number ) recommended accuracy number for Gold is 5or 6, for eurusd 6 or 7. other instru
Trend Indicator This Indicator detects the essential momentum in the market and lets you know when the market has a potential trend Green means we are going higher and Red Means we are going Lower,  You can customise the Line to Any Color.  The alerts come in immediately there is a potential signal Defaults Length : 55 This is the Depth of your averaging calculation. The bigger it is the more noise is filtered.  55 Is the Best Optimum Setting For This Indicator
KijunSen vs Price Ichimoku Strategy MM Description in English and Italian = This Indicator is based on one of the Strategies with Ichimoku Indicator, in particular is the cross of the KijunSen with the Current Price; it will give you of Buy and Sell when they Cross, with Arrows and Alerts. When you attach the indicator on the chart , a window will open where , in the INPUT section, you can also choose to change the main Ichimoku values. SIGNAL INPUT =    · BUY = when Price cross above
The Smooth Price technical indicator is used for plotting a smoothed line as close to the price of the financial instrument as possible, and serves to eliminate its noise components. The indicator is part of the Monarch trading system, but here it is presented as an independent technical analysis tool. The indicator is based on the cluster digital filter , which, unlike the ClusterSMA , is applied directly to the price time series. Smooth Price does not redraw (except the very last, zero bar) an
BinaryIndicator is a highly accurate indicator for trading binary options. It shows excellent results in scalping. This indicator is based in multifactor analysis of trend indicators, as well as confirmation oscillators, which in the end gives an increased accuracy of signals. Advantages of the indicator Increased accuracy of signals. Excellent results when trading binary options with a short expiration time from M30 to M1 . It works on any timeframes. Works with any trade symbols. Parameter
The Before indicator predicts the most likely short-term price movement based on complex mathematical calculations. Most of the standard indicators commonly used in trading strategies are based on fairly simple calculations. This does not mean that there were no outstanding mathematicians in the world at the time of their creation. It is just that computers did not yet exist in those days, or their power was not enough for the sequential implementation of complex mathematical operations. Nowa
Afidealn - インディケータはバイナリ オプション用に設計されています! 矢印インジケーター Afidealn は、期間で最良の結果を表示します。 M1 M5 M15 もういらない! 青い矢印を上に置きます 赤い矢印を下に置く 信号は、10 ~ 15 秒の遅延で現在のろうそくに表示されます。 Afidealn は、このような信号遅延のために、いくつかの指標に取り組んでいます。 マルチカレンシー!さまざまな通貨ペアで動作し、結果は優れていました。 また、おすすめインジケーターはニュースに非常に敏感です。 ニュース中に取引することはお勧めしません 最良の結果を得るには、2 分間取引を開始することをお勧めします 通貨ペアドルユーロは彼にとって最高です! テストして結果を確認してください!
This is a trend indicator without redrawing Developed instead of the binary options strategy (by the color of the Martingale candlestick) Also works well in forex trading When to open trades (binary options) A signal will appear in the place with a candle signaling the current candle It is recommended to open a deal for one candle of the current timeframe M1 and M5 When a blue dot appears, open a deal up When a red dot appears, open a trade down. How to open trades on Forex. When a signal is rec
"The trend is your friend" is one of the best known sayings in investing, because capturing large trendy price movements can be extremely profitable. However, trading with the trend is often easier said than done, because many indicators are based on price reversals not trends. These aren't very effective at identifying trendy periods, or predicting whether trends will continue. We developed the Trendiness Index to help address this problem by indicating the strength and direction of price trend
Smart Reversal Signal  is a professional indicator for the MetaTrader 4 platform; it has been developed by a group of professional traders. This indicator is designed for Forex and binary options trading. By purchasing this indicator, you will receive: Excellent indicator signals. Free product support. Regular updates. Various notification options: alert, push, emails. You can use it on any financial instrument (Forex, CFD, options) and timeframe. Indicator Parameters Perod - indicator calcula
The idea of the indicator is based on the ZigZag indicator using a new equation with the addition of volume. Inputs InpDepth — Depth. InpDeviation — Deviation. InpBackstep — Backstep. Enable_Alert — audio and text notifications on a trend change. Send_Notifications — push notifications to mobile devices. E-mail alert — email notifications. Make sure to configure email parameters in the terminal settings. Features The indicator does not repaint. The indicator does not recalculate. The indicat
TrendySignalMt4l is a trend-following indicator that quickly responds to a trend change. The indicator forms the line so that it is always located above or below the chart depending on a trend. This allows using the indicator both for a trend analysis and setting stop loss and take profit. The indicator should be attached in the usual way. It works on any timeframe from M1 to MN and with any trading symbols. The indicator has no configurable inputs. Recommendations on working with the indicato
Trend Line Chart Pattern Signals  Is a traders Tool for Signals based on Strong  Patterns Formed By a pair of robust trend lines. They FOR WITH DIFFERENT POPULAR PATTERNS ON CHARTS LIKE – TRIANGLES, FLAGS,RANGE , ASCENDING TRIANGLES, DESCENDING PATTERNS, PENNANTS ETC. The TREND LINES  form  dynamically  on running bars. The  sensitivity  of the trend lines can be changed by custom settings. The  Buy and Sell Signals Generate upon Break Of the Trend Line + "Close" of the same bar above the previo
Wolfe Waves scanner - It scans all the Symbols and identify the movement of price and it gives confidence in trade. It automatically plots  fifth wave breaks out of the channel. According to the theory behind the pattern, a line drawn from the point at the beginning of the first wave and passing through the beginning of the fourth wave predicts a target price for the end of the fifth wave. If a trader properly identifies a Wolfe Wave as it forms, the beginning of the fifth wave represents an op
Towers - Trend indicator, shows signals, can be used with optimal risk ratio. It uses reliable algorithms in its calculations. Shows favorable moments for entering the market with arrows, that is, using the indicator is quite simple. It combines several filters to display market entry arrows on the chart. Given this circumstance, a speculator can study the history of the instrument's signals and evaluate its effectiveness. As you can see, trading with such an indicator is easy. I waited for an a
このプロダクトを購入した人は以下も購入しています
Enigmera
Ivan Stefanov
5 (3)
エニグメラ:市場の中核 https://www.enigmera.com はじめに このインディケータと取引システムは、金融市場に対する驚くべきアプローチです。ENIGMERAは、フラクタルサイクルを使用して、サポートとレジスタンスレベルを正確に計算します。本格的な蓄積局面を示し、方向性と目標を示します。 トレンド中でも調整中でも機能するシステムです。 どのように作動するのか? ENIGMERAは、支持線・抵抗線、目標線、乖離線の3つのラインで構成されています。このシステムは、過去のデータを現在と未来に外挿する典型的な市場指標とは異なり、現在の完全な画像を提供します。支持線上にある場合、それは本当の支持を意味し、抵抗線上にある場合、それは本当の抵抗を意味する。ある水準が破られた場合、それはトレンドの変化を意味する。再描画はしない。 市場は常に進化しているため、ENIGMERAはその評価ツールを適応させ、定期的に戦略を修正しています。  これにより、すべてのシナリオが徹底的に評価されることが保証されます。この市場指標の独自性は、その能力を見れば明らかです。  ENIGM
Indicator : RealValueIndicator Description : RealValueIndicator is a powerful tool designed specifically for trading on the EURUSD pair. This indicator analyzes all EUR and USD pairs, calculates their real currency strength values, and displays them as a single realistic value to give you a head start on price. This indicator will tell you moves before they happen if you use it right. RealValueIndicator allows you to get a quick and accurate overview of the EURUSD currency pair tops and bottoms,
Gold Channel is a volatility-based indicator, developed with a specific timing algorithm for the XAUUSD pair, which consists of finding possible corrections in the market. This indicator shows two outer lines, an inner line (retracement line) and an arrow sign, where the theory of the channel is to help identify overbought and oversold conditions in the market. The market price will generally fall between the boundaries of the channel. If prices touch or move outside the channel it is a tra
Gann Signal is a very simple indicator at first glance, but hidden inside is many years of experience in studying W.D.Ganna methods. The indicator gives accurate BUY/SELL signals, without redrawing. The indicator is very easy to use. All you need to do is attach it to your chart and follow its recommendations. The indicator constantly analyzes the market for entry opportunities. When such an opportunity appears, the indicator gives a signal in the form of an arrow. I repeat, all signals are NOT
Please send me Direct message on MQL5 CHAT after purchasing the Indicator for Training and Installation Support There are some additional files that is important to use with the Indicator . So be sure to contact me after purchasing the Indicator So that I can add you for training and support . If you find any difficulty with installation then send me Direct message here So that I can connect with you via Anydesk or Teamview for the product installation. " Smart Order Block Indicator " to find
TrendMaestro
Stefano Frisetti
5 (3)
note: this indicator is for METATRADER4, if you want the version for METATRADER5 this is the link:  https://www.mql5.com/it/market/product/108106 TRENDMAESTRO ver 2.4 TRENDMAESTRO recognizes a new TREND in the bud, he never makes mistakes. The certainty of identifying a new TREND is priceless. DESCRIPTION TRENDMAESTRO identifies a new TREND in the bud, this indicator examines the volatility, volumes and momentum to identify the moment in which there is an explosion of one or more of these data a
もちろんです。以下は、提供いただいたテキストの日本語への翻訳です: MT4用の天文学指標をご紹介します:究極の天体トレーディングコンパニオン トレーディング体験を天空の高みに高める準備はできていますか?私たちの革命的なMT4用の天文学指標をご紹介します。この革新的なツールは、複雑なアルゴリズムの力を借りて、類まれなる天文学的洞察と精密な計算を提供します。 あなたの指先で宇宙の情報を: 宝のような天文学的データが明らかになる包括的なパネルをご覧ください。惑星の地理的/太陽中心座標、太陽と地球の距離、星の大きさ、伸び、星座、黄道座標および赤道座標、さらには水平座標まで、それぞれが綿密に計算され美しく表示されています。指標によって生成される垂直線は時間値に対応し、トレーディングの旅に宇宙の視点を提供します。 惑星のラインと関係: グラフを飾る惑星のラインの魔法を体験し、スケールと角度をカスタマイズできます。直感的なコントロールパネルを介して各惑星のラインの表示を簡単に切り替えることができます。指定された時刻範囲内での合会、六分会、四分会、三分会、対会、逆行の指標で天体の関係の芸術を発見してく
トレンドトレーディング は、タイミングのプルバックとブレイクアウトにより、市場で起こっているトレンドから可能な限り利益を得るように設計された指標です。確立されたトレンドの中で価格が何をしているかを分析することにより、取引の機会を見つけます。 [ インストールガイド | 更新ガイド | トラブルシューティング | よくある質問 | すべての製品 ] 自信を持って効率的に金融市場を取引する むち打ちにならずに確立されたトレンドから利益を得る 収益性の高いプルバック、ブレイクアウト、早期の逆転を認識する この指標は、独自の品質とパフォーマンスを分析します 複数時間枠のダッシュボードを実装します インジケーターは再描画されていません 電子メール/音声/視覚アラートを実装します 確立されたトレンドは多くの取引機会を提供しますが、ほとんどのトレンド指標はそれらを完全に無視しています。インジケーターの解釈はかなり簡単です: (1) トレンドの変化 (2) トレンドの方向への後退 (3) トレンドの方向へのブレイクアウト 赤いダッシュ は下降トレンド中の修正です 青いダッシュ は上昇ト
How to use Pair Trading Station Pair Trading Station is recommended for H1 time frame and you can use it for any currency pairs. To generate buy and sell signal, follow few steps below to apply Pair Trading Station to your MetaTrader terminal. When you load Pair Trading Station on your chart, Pair Trading station will assess available historical data in your MetaTrader platforms for each currency pair. On your chart, the amount of historical data available will be displayed for each currency pai
The indicator " ZigZag on Trend " is an assistant in determining the direction of price movement, as well as a calculator of bars and points. It consists of a trend indicator, which follows the price direction by the trend line presented in the form of a zigzag and a counter calculating the number of bars traversed in the direction of the trend and the number of points on the vertical scale. (calculations are carried out by the opening of the bar) The indicator does not redraw. For convenience,
回帰取引を意味する専門的かつ定量的なアプローチを実装する独自の指標。これは、価格が予測可能かつ測定可能な方法で迂回して平均に戻るという事実を利用しており、非定量的な取引戦略を大幅に上回る明確な出入りルールを可能にします。 [ Installation Guide | Update Guide | Troubleshooting | FAQ | All Products ] 明確な取引シグナル 驚くほど簡単に取引できます カスタマイズ可能な色とサイズ パフォーマンス統計を実装します ほとんどの取引戦略を上回ります 適切なSLおよびTPレベルを表示します 電子メール/音声/視覚アラートを実装します 使い方 インディケータは、より高い時間枠からの完全にカスタマイズ可能な移動平均の周りの標準偏差を測定し、トレンドフォローアプローチを使用して正確に取引を見つけます。取引は、現在のチャートの価格アクションに飛び込むことによって見つけられ、価格が選択したより高い時間枠から計算された平均価格帯に戻ったときに閉じられます。それがコード化される方法のために、指標は高ボラティリティと強いトレンドの
驚異的なFXインジケーター「Miraculous」をご紹介します。完璧な結果を得るための1時間足を含むすべてのタイムフレームで効果的に機能する、最強の強力な特殊MT4フォレックスインジケーターです。 すべてのタイムフレームで優れた結果を提供する最高のFXインジケーターを探し続けるのに疲れましたか?これ以上探す必要はありません!「Miraculous」フォレックスインジケーターをご紹介します。このインジケーターは、トレーディングの経験を変革し、収益を新たなレベルに引き上げるために設計されました。 先進のテクノロジーと長年にわたる緻密な開発に基づいて構築された「Miraculous」フォレックスインジケーターは、FX市場における力と正確さの頂点となります。この素晴らしいツールは、すべてのレベルのトレーダーのニーズを満たすように設計されており、一貫した収益性を追求する上で比類のない優位性を提供します。 「Miraculous」フォレックスインジケーターの他との違いは、その非常に適応性にあります。デイトレーダー、スウィングトレーダーであろうと、長期ポジションを好む方であろうと、このインジケータ
Introduction to X3 Chart Pattern Scanner X3 Cherart Pattern Scanner is the non-repainting and non-lagging indicator detecting X3 chart patterns including Harmonic pattern, Elliott Wave pattern, X3 patterns, and Japanese Candlestick patterns. Historical patterns match with signal patterns. Hence, you can readily develop the solid trading strategy in your chart. More importantly, this superb pattern scanner can detect the optimal pattern of its kind. In addition, you can switch on and off individu
Currently Price 20% OFF ( for unlimited use )   BONUS  AUX VIP Club 2024 : Include  EA Airbag  and  Load Data History  to enhance the performance of this tool to its maximum potential  Click Here to Download Files   ( for users only )   Hello World! Introducing.. SMCpro VIP tool and Indicator for MetaTrader 4, designed to revolutionize your trading experience with the ICT Smart Money Concept. This system is meticulously crafted to empower traders with advanced insights and precision in
Max Payneは、矢印の形でシグナルを与える反転/トレンドシグナルインジケーターです。このインジケーターは、同じバーの終値でシグナルを出します。このインジケーターは、異なる期間でチャート上に複数回ドロップして、シグナルの2倍/3倍の確認を取得できます。 このインジケーターは、あらゆる取引スタイルに合わせて高度に調整できますが、再描画やバックペイントは一切行われません。購入後には、使用したテンプレートとともにスクリーンショットに表示される完全なシステムが表示されます。 ----------------- 取引方法: トレンドフィルター(購入後に得られるペイントレンド)が方向に一致している間、同じバーでトリプル確認が得られるまで待ちます 取引を開始し、買い取引の場合は金色の矢印 (テンプレート) より下、売り取引の場合は金色の矢印 (テンプレート) より上にストップロスを設定します。終了シグナルは最初の反対側の白い点のシグナル (テンプレート) です。 ----------------- パラメーター : 信号周期:矢印周期 フィルター: 信号フィルター 距離 : ローソクからの矢印
This indicator is based on the mathematics of the great trader W.D. Ganna. With its help, you can easily find strong levels by analyzing swings to find the optimal entry point. The indicator works on all instruments and all timeframes. The indicator is fully manual and has control buttons. All you need to do is press the NEW button, a segment will appear, which you can place on any movement, swing or even 1 candle that you want to analyze. By placing the segment, press the OK button. A grid (th
Limitless MT4は、すべての初心者と経験豊富なトレーダーに適したユニバーサルインジケーターです。 すべての通貨ペア、暗号通貨、生の株式で動作します 無制限のMT4-構成済みで、追加の構成は不要 そして今、主なもの なぜ無制限のMT4なのか? 1再描画の完全な欠如 2トレーディングの最高のスペシャリストによる2年間のテスト 3正しい信号の精度が80%を超える 4ニュースリリース中の取引で好調 取引ルール 1買いシグナル-青い上向き矢印の出現 下向きの赤い矢印の外観を販売するシグナル シグナル後の次のローソク足で取引を開始するには2 3テイクプロフィット チャート上 М1-40ピップ М5-50ピップ М15-55-60ピップ 4ストップロスは利益をとる 5誤った信号をフィルタリングするために、 パラボリックSAR-トレンドとのトレードへの参入を除外する移動平均または同様のトレンドインジケーター。 
Ultimate Sniper Dashboard
Hispraise Chinedum Abraham
4.84 (25)
299ドルで割引中! 今後値上げの可能性あり! 下の説明を読んでください! 究極のスナイパーダッシュボードのための最高のエントリーシステム。究極のダイナミックレベル。(私の製品をチェックしてください) 究極のスナイパーダッシュボードはMT4多通貨テスト制限のため、ライブマーケットでのみ作動します。 究極のスナイパーダッシュボードをご紹介します。HA-Sniper、MA-Sniper、その他多くの特別なモードが含まれる最高の製品です。究極のスナイパーダッシュボードは絶対的な獣です! 初心者やエキスパートトレーダーにとって最高のソリューションです。もう二度と動きを見逃さない! シンプルさとピップを愛するトレーダーのために、特別な製品をご用意しました。シンプルでありながら、ダッシュボードは複数のカスタムアルゴリズムに基づき28の通貨ペアを監視し、すべての作業を行います。たった一つのチャートで、プロのように市場を読み解くことができます。もし、為替ペアが動き出したときに、その方向性を正確に特定することができれば、あなたの取引はどれほど改善されることでしょう。   当社のシ
Weis Wave with Alert
Trade The Volume Waves Single Member P.C.
4.8 (20)
Rental/Lifetime Package Options and Privileges' * For optimum results the yearly or lifetime package is suggested due to live training and Discord  channel trading with the  creator! Rent Monthly Six Months   Yearly/Lifetime Weis Wave with Speed with Alert+Speed Index x x x Manual  x x x Quick Set up Video x x x Blog x x x Lifetime Updates x x x Setup and Training Material x x Free Rectangle Break Alert Tool      x Discord Access Channel "The SI traders" x 2-hour live methodology traini
スイングトレーディング は、トレンドの方向のスイングと可能な反転スイングを検出するように設計された最初のインジケーターです。トレーディングの文献で広く説明されているベースラインスイングトレーディングアプローチを使用します。インディケータは、いくつかの価格と時間のベクトルを調査して、全体的なトレンドの方向を追跡し、市場が売られ過ぎまたは買われ過ぎて修正の準備ができている状況を検出します。 [ インストールガイド | 更新ガイド | トラブルシューティング | よくある質問 | すべての製品 ] むち打ちを起こさずに市場スイングの利益 インジケーターは常にトレンドの方向を表示します 色付きの価格帯は機会のベースラインを表します 色付きのダッシュは、可能な反転スイングを表します この指標は、独自の品質とパフォーマンスを分析します 複数時間枠のダッシュボードを実装します カスタマイズ可能なトレンドおよびスイング期間 電子メール/サウンド/プッシュアラートを実装します インジケータは再描画またはバックペインティングではありません Swing Tradingとは Swing Tradi
A. A2SR とは何ですか ?   * 先行テクニカル指標です (塗り直しなし、ラグなし)。 -- ガイダンス : -- https://www.mql5.com/en/blogs/post/734748/page4#comment_16532516 -- そして https://www.mql5.com/en/users/yohana/blog A2SR には、サポート (需要) とレジスタンス (供給) のレベルを決定する特別な手法があります。 ネットで見かける通常の方法とは異なり、A2SR は実際の SR レベルを決定する独自のコンセプトを持っています。 元の手法はインターネットから取得されたものではなく、インターネット上で公開されたこともありません。 A2SR は、取引スタイルに応じて SR レベルを自動選択します。 時間枠を変更しても、SR レベルはその位置にとどまります。 実際のSRは、使用する時間枠から取得されるわけではないため. A2SR には、取引のための完全な手段があります 。 実際のサポート (需要) とレジスタンス (供給) の真のコンセプト。
IA Trendx3 PRO
Marco Aurelio Santos Costa
What if God Created a Trade System? No miracles... Just see how mathematics can be effective in the market. We managed to combine technical analysis / price action into indicators, creating the best setup for trading, be it in Forex, Indices, or stocks. It took us 2 years to create something that really works, and now it's time for you to discover it. TrendX3 is a revolution in trend analysis. Based on advanced algorithms and real-time data, it provides valuable insights so that you can make inf
Hi traders, I'm glad to bring to you the market analysis tool called "Infinity Trend Indicator". The main goal of this indicator is to help you figure-out  the beginning of a new trend and the end of the trend current trend.  NOTE:  THIS INDICATOR DOESN'T REPAINT!! How to use this Indicator 1. Based on the Infinity trend indicator only We look to buy when the yellow line is pointing or curving up after a strong bearish move We look to sell when the yellow line is pointing or curving downward aft
Liquidity Pro The Liquidity Pro pin points liquidity zones in any financial instrument, including currency pairs, cryptocurrencies, commodities, equities and indices. The Liquidity Pro shows previous and current liquidity zones, down to the present minute, providing essential information about your chosen trading pair, when conducting chart analysis or initiating trades. Remember each trading pair requires a different price separation value for M5, M15 and M30 Tally, to provide accurate data. Y
これはほぼ間違いなく、MetaTraderプラットフォームで見つけることができる最も完全な調和価格形成自動認識インジケーターです。 19種類のパターンを検出し、フィボナッチプロジェクションをあなたと同じように真剣に受け止め、潜在的逆転ゾーン(PRZ)を表示し、適切なストップロスとテイクプロフィットレベルを見つけます。 [ インストールガイド | 更新ガイド | トラブルシューティング | よくある質問 | すべての製品 ] 19の異なる調和価格形成を検出します プライマリ、派生および補完フィボナッチ投影(PRZ)をプロットします 過去の価格行動を評価し、過去のすべてのパターンを表示します この指標は、独自の品質とパフォーマンスを分析します 適切なストップロスとテイクプロフィットのレベルを表示します ブレイクアウトを使用して適切な取引を通知します すべてのパターン比をグラフにプロットします 電子メール/音声/視覚アラートを実装します スコット・M・カーニーの本に着想を得て、この指標は最も純粋で急を要するトレーダーのニーズを満たすように設計されています。ただし、トレードを
The indicator is designed to work on any trading platform. The program is based on proprietary algorithms and W.D.Ganna's mathematics, allowing you to calculate target levels of price movement based on three points with the highest degree of certainty. It is a great tool for stock trading. The indicator has three buttons: NEW - call up a triangle for calculation. DEL - delete the selected triangle. DELS - completely remove all constructions. The probability of achieving the goals is more than 80
Connect Indicator is a tool used for connecting indicators between the MQL market and MT4. The connected indicators are made by our group and can be used for other applications, such as sending messages to the Line application or Telegram application. If you have any questions, please don't hesitate to ask us to receive support. Function and indicator buffer Buffer one is the high price of the previous candle. Buffer two is the high price of the previous candle. Usage To connect indicators to fu
Full Forex Market View Dashboard
Opengates Success International
5 (2)
FULL FOREX MARKET VIEWダッシュボードインジケーター これは、トレーダーが市場で何が起こっているかを完全に把握できるようにするために作成されたカスタム指標です。 リアルタイム データを使用して市場にアクセスし、取引を成功させるために必要なあらゆる情報を表示します。 インストール: このインジケーターをウィンドウ チャートに添付する前に、MT4 のマーケット ウォッチ パネルに移動し、不要な通貨ペアまたは取引しないすべての通貨ペアを非表示にして、残りをそこに残します。 その理由は、FFMV ダッシュボードが MT4 の気配値表示に表示されるすべての通貨ペアを表示するためです。 最大 30 通貨ペア以下を表示できます。 MT4 の気配値表示でそれ以上だと、FFMV ダッシュボードのフォントと画像がぼやけて変形します。 正しく表示されません。 使用法:      個人取引の場合      バスケット取引の場合 (方法についてはスクリーンショットを参照してください)      複数注文取引にも使用可能      独自の取引システムなどから
The breakout algorithm is a technique based on price, price features, to shape a breakout strategy. The strategy in this indicator will not be redrawn (none-repaint indicator), it is suitable for short or long term traders In the screenshot is the EURUSD pair, these currency pairs, commodities or stocks, it have similar strength *Non-Repainting (not redrawn) *For Metatrader4 Only *Great For Scalping *Great For Swing Trading *Arrow Entry, Green is Long, Red is Short *Works On Any Timeframe *Work
OFFER!   OFFER ! After 3 weeks the unlimited price will be 500$ and in the future you will regret why you didn't make a purchase at this lowest price. Dear Traders, the atomic power Entries Indicator is one of the indicators that if used wisely and correctly can help you to find an edge over the market.  The indicator will work for all forex pairs, all markets and all timeframes. Still it is your duty to find the most effective timeframe for you. When the sell or buy arrow appears you will get a
作者のその他のプロダクト
MT4 Version Order Blocks Zone Scalper is dedicated to all people who like order blocks trading but do not have the time to stare at the charts every day or the discipline to follow a trading strategy. It is also for everyone who likes to experiment and optimize parameters on their own. If you belong to this type of person, it is your lucky day, as I decided to keep all EA parameters available to you so that you can optimize the EA to your own taste. To understand how this EA works, come read my
[ MT5 Version ] Only the next 10 units at current price! Final price: $299 Are you tired of spending months on demo or live accounts to test your trading strategies? The Backtesting Simulator is the ultimate tool designed to elevate your backtesting experience to new heights. Utilizing Metatrader historical symbol information, it offers an unparalleled simulation of real market conditions. Take control of your testing speed, test ideas quickly or at a slower pace, and witness remarkable improvem
[ MT4 Version ] How to trade using the Fear and Greed Indicator:  Click here Uncertain about when to take total or partial profits? The   Fear and Greed   is your reliable companion for making confident trading decisions. This innovative tool offers unparalleled insights into market sentiment, helping you identify key pivot zones and optimize your trading strategy. Why Choose Fear and Greed? Revolutionary Market Insight: Sentiment Analysis:   The first indicator for that reveals the market's Fea
MT4 Version   MA Ribbon MT5 MA Ribbon is an enhanced indicator with 8 moving averages of increasing periods. MA Ribbon is useful to recognize trend direction,  reversals   and continuation points in the market as well as potential entry, partial take profit and exit points. Entry points for long and shorts position can be found when the price entries or leaves the Ribbon, at retest or a defined number of MA crossovers. It offers a good combination with mostly any volume or momentun indicators to
FREE
MT4 Version Fibonacci Bollinger Bands MT5 Fibonacci Bollinger Bands is a highly customizable indicator that shows areas of support and resistance. This indicator combines the logic for the Bollinger Bands with the Fibonacci level. Fibonacci Bollinger Bands is the first   indicator in the market that allows the user to 100% customize up to 12 Fibonacci levels, the Moving Average type and the price data source to use for the calculations. This flexibility makes the Fibonacci Bollinger Bands easily
FREE
[ MT4 Version ] Only the next 10 units at current price! Final price: $299 Are you tired of spending months on demo or live accounts to test your trading strategies? The Backtesting Simulator is the ultimate tool designed to elevate your backtesting experience to new heights. Utilizing Metatrader historical symbol information, it offers an unparalleled simulation of real market conditions. Take control of your testing speed, test ideas quickly or at a slower pace, and witness remarkable improve
[ MT5 Version ] Only the next 10 units at current price! Final price: $299 How to trade using Order Blocks:  Click here Discover the future of trading with   Order Block Indicator , meticulously crafted for traders who demand unparalleled accuracy and customization. Whether you're scalping or swing trading, this tool is your gateway to mastering Order Blocks and Supply and Demand Zones—critical areas where price reversals often occur. Why Choose Order Block Indicator? Transform Your Trading Stra
MT5 Version Elliot Wave Oscillator MT4 Elliot Wave Oscillator MT4 is an indicator designed to support Elliot Wave counts. The default settings help filtering out the noise in the market allowing a clear perception for the waves counts in differnt timeframes.   Elliot Wave Oscillator high customization level allows the you to optimize this indicator to your personal preferences. Shorter Periods and faster reactive MAs will provide more infomation but will require a higher level of experience for
MT5 Version MA Ribbon MT4 MA Ribbon is an enhanced indicator with 8 moving averages of increasing periods. MA Ribbon is useful to recognize trend direction,  reversals   and continuation points in the market as well as potential entry, partial take profit and exit points. Entry points for long and shorts position can be found when the price entries or leaves the Ribbon, at retest or a defined number of MA crossovers. It offers a good combination with mostly any volume or momentun indicators to f
FREE
MT5 Version Fibonacci Bollinger Bands MT4 Fibonacci Bollinger Bands is a highly customizable indicator that shows areas of support and resistance. This indicator combines the logic for the Bollinger Bands with the Fibonacci level. Fibonacci Bollinger Bands is the   first   indicator in the market that allows the user to 100% customize up to 12 Fibonacci levels, the Moving Average type and the price data source to use for the calculations. This flexibility makes the Fibonacci Bollinger Bands easi
FREE
[ MT4 Version ] Advanced Bollinger Bands RSI EA MT5 Advanced Bollinger Bands RSI EA is an Expert Advisor based on the worldwide known strategy BB & RSI. This strategy uses the Bollinger Bands indicator in combination with the RSI, the signal triggers only when both the BB and the RSI indicate at the same time overbought or oversold conditions. Both indicators make a great combination to anticipate big explosive moves. Advanced Bollinger Bands RSI EA grants the user the posibity to use 3 differen
MT5 Version SMT Divergences MT4 SMT Divergences is one of the most innovative indicators in the market. It offers the possibility of analyzing price divergences between 2 pairs. These divergences highlight and help to foresee what banks and institutions are planning to do. SMT divergences also provides you with a kill zones indicator and the possibility of filtering divergences occurring during these kill zones.  The strategy tester is limited in MT4. Contact the author to get your Demo Version
MT5 Version Gaussian Channel MT4 Gaussian Channel MT4 is the first indicator in the market that uses Ehlers Gaussian Filter methods to define trends. Nowadays, this Gaussian Channel is highly known as a method to support HOLD techniques in crypto. If the price is above the channel the trend is strong, if it comes back to the channel this can react as a resistance and indicate the beginning of a bear market (or Winter) if the price breaks below it. Eventhough the use of this channel focuses on
MT4 Version Kill Zones Kill Zones allows you to insert up to 3 time zones in the chart. The visual representation of the Kill Zones in the chart together with an alert and notification system helps you to ignore fake trading setups occurring outside the Kill Zones or specific trading sessions. Using Kill Zones in your trading will help you filter higher probability trading setups. You should select time ranges where   the market   usually reacts with high volatility. Based on   EST time zone, f
[ MT4 Version ] Bulls and Bears Power Bulls and Bears Power is an indicator that clearly highlights if bulls or bears are currently in control of the market. A price movement started with high Bulls control in the market can indicate the beginning of a new trend movement. The relative indicator power between price peaks also indicates if the movement is losing strength and might foresee a significant correction or a trend reversal. Bulls and Bears Power indicator offers a clear and simplified vi
MT4 Version Wave Trend MT5 Wave Trend is an oscillator, which helps identifing in a extremely accurate manner market reversals. The Oscillator being obove the overbought level and a cross down of the fast into the slow MA usually indicates a good SELL signal. If the oscillators is below the oversold level and the fast MA crosses over the slower MA usually highlights a good BUY signal. The Wave Trend indicator can be also used when divergences appear against the price, indicating the current move
Lumos
Diego Arribas Lopez
Lumos Lumos is a multifunctional trading assistant. It gives an overview of the current market situation for a better decision making. The strategy tester only provides a visualization of the application. Lumos is highly customizable and gives you information in multiple timeframes about: MAs, price structure, RSI, RSI MA and an overview of the price distance to possible SLs.
FREE
[ How to use the Demo version ]  [ MT5 Version ]  AO unpaid divergences MT4 AO unpaid divergences is the first indicator developed to detailed analyze Regular and Hidden Divergences. It uses this analysis to find out possible entry points and targets. Below some of the characteristics of this indicator:  Time saving Highly customizable Working for all pairs (Crypto, Forex, Stocks, Indices, Commodities...) Suitable for Scalping or Swing trading Possible reversal swings Alerts and Notifications on
[ MT5 Version ] How to trade using the Fear and Greed Indicator:  Click here Uncertain about when to take total or partial profits? The Fear and Greed is your reliable companion for making confident trading decisions. This innovative tool offers unparalleled insights into market sentiment, helping you identify key pivot zones and optimize your trading strategy. Why Choose Fear and Greed? Revolutionary Market Insight: Sentiment Analysis: The first indicator for that reveals the market's Fear and
MT5 Version TTM Squeeze Momentum TTM Squeeze Momentum is an enhanced indicator ideal for recognizing consolidation periods in the market and the start of the next explosive move. This improved version is a volatility indicator based on John Carter's "TTM Squeeze" in which the histogram is based on a linear regression rather than a simple momentum indicator. Red dots on the middle line indicate that the market has entered a "Squeeze" zone or consolidation period, indicated in this enhanced vers
MT5 Version Williams Vix Fix MT4 Need help trying to time the bottoms in the market? Williams Vix Fix MT4 is based on the volatility of the market and grants a huge support for finding out when a correction is comming to its end. TRY IT FOR FREE NOW! Williams Vix Fix MT4 derivates from Larry Williams's VixFix indicator addapted for fitting   every asset class . VIX reprensents the fear and greed in the market based on its volatility. A high VIX value shows fear in the market, this is usually a
MT5 Version   Wave Trend MT4 Wave Trend is an oscillator, which helps identifing in a extremely accurate manner market reversals. The Oscillator being obove the overbought level and a cross down of the fast into the slow MA usually indicates a good SELL signal. If the oscillators is below the oversold level and the fast MA crosses over the slower MA usually highlights a good BUY signal. The Wave Trend indicator can be also used when divergences appear against the price, indicating the current mo
MT5 Version Multi Timeframe MA MT4 Multi Timeframe MA MT4 is an indicator that offers the representation of up to 3 MAs with different Periods and Timeframes. This allows the user to reprensent in one chart and timeframe information coming from other timeframes and get notified as any of the MAs crosses another one. Multi Timeframe MA is the   first   indicator in the market that offers Multi Timeframe interactions and a high customization   level from up to 7 different MA types (SMA, EMA, WMA,
[ MT5 Version ] Structure Breakout  EA MT4 Structure Breakout EA is an Expert Advisor inspired by structure breakout trading. It seeks to capture the explosive movements that follow a period of consolidation. It allows the user to adapt the EA to trend breakouts automatically recognized by the robot or to price structure breakouts. It is also highly customizable, which allows it to be easily adapted to different pairs, timeframes and risk profiles. It is independent of market sessions. The numbe
[ MT5 Version ] Advanced Bollinger Bands RSI EA MT4 Advanced Bollinger Bands RSI EA is an Expert Advisor based on the worldwide known strategy BB & RSI. This strategy uses the Bollinger Bands indicator in combination with the RSI, the signal triggers only when both the BB and the RSI indicate at the same time overbought or oversold conditions. Both indicators make a great combination to anticipate big explosive moves. Advanced Bollinger Bands RSI EA grants the user the posibity to use 3 differen
[ MT5 Version ] [ EA ] Advanced Bollinger Bands RSI MT4 Advanced Bollinger Bands RSI is an Indicator based on the functionalities of the  Advanced Bollinger Bands RSI EA . The scope of this indicator is to provide a more affordable solution for users interested in the alerts coming out of the strategy but not in Autotrading. This strategy uses the Bollinger Bands indicator in combination with the RSI, the signal triggers only when both the BB and the RSI indicate at the same time overbought or
[ MT5 Version ] Supply and Demand Multitimeframe Supply and Demand Multitimeframe is the first indicator in the market that combines multiple aspects like trading volume, price structure and momentum to identify Supply and Demand zones for every asset. The Supply and Demand indicator analyzes simultaneously up to 4 different TFs and represents their information in the current graph. Its interactive UI highlights everytime the price enters a Supply or Demand zone even if the zones are not visib
[ MT5 Version ] Bulls and Bears Power Bulls and Bears Power is an indicator that clearly highlights if bulls or bears are currently in control of the market. A price movement started with high Bulls control in the market can indicate the beginning of a new trend movement. The relative indicator power between price peaks also indicates if the movement is losing strength and might foresee a significant correction or a trend reversal. Bulls and Bears Power indicator offers a clear and simplified vi
[ MT5 Version ] Ultimate Alpha Trend MT4 Ultimate Alpha Trend is the first trend indicator, which combines volatility, volume, average price and momentum. The results is a highly versatile representation of trendy and sideways market conditions, highlighting, at the same time, significant supply and demand levels. The Ultimate Alpha Trend indicator can be used to find entry oportunities and to set SLs taking into consideration current market volatility, volume and momentum. Besides that, the in
MT5 Version Order Blocks Zone Scalper   is dedicated to all people who like order blocks trading but do not have the time to stare at the charts every day or the discipline to follow a trading strategy. It is also for everyone who likes to experiment and optimize parameters on their own. If you belong to this type of person, it is your lucky day, as I decided to keep all EA parameters available to you so that you can optimize the EA to your own taste. To understand how this EA works, come read m
フィルタ:
Schneider568
54
Schneider568 2023.05.20 18:22 
 

ユーザーは評価に対して何もコメントを残しませんでした

Diego Arribas Lopez
8707
開発者からの返信 Diego Arribas Lopez 2023.05.20 23:58
I am glad you like it. Thank you for your feedback :)
Junaid Munawar
971
Junaid Munawar 2023.04.19 19:24 
 

Very interesting indicator always like it author improving UI which help a lot.

Diego Arribas Lopez
8707
開発者からの返信 Diego Arribas Lopez 2023.04.21 10:46
Happy to hear that! Thank you for your review :)
レビューに返信
バージョン 1.3 2023.11.26
1. UI update for multiple screen resolutions
バージョン 1.2 2023.04.19
1.Versioning update
バージョン 1.1 2023.04.16
1. Input update