Harami Candle Alert MT5
- インディケータ
- Prafull Manohar Nikam
- バージョン: 1.0
- アクティベーション: 5
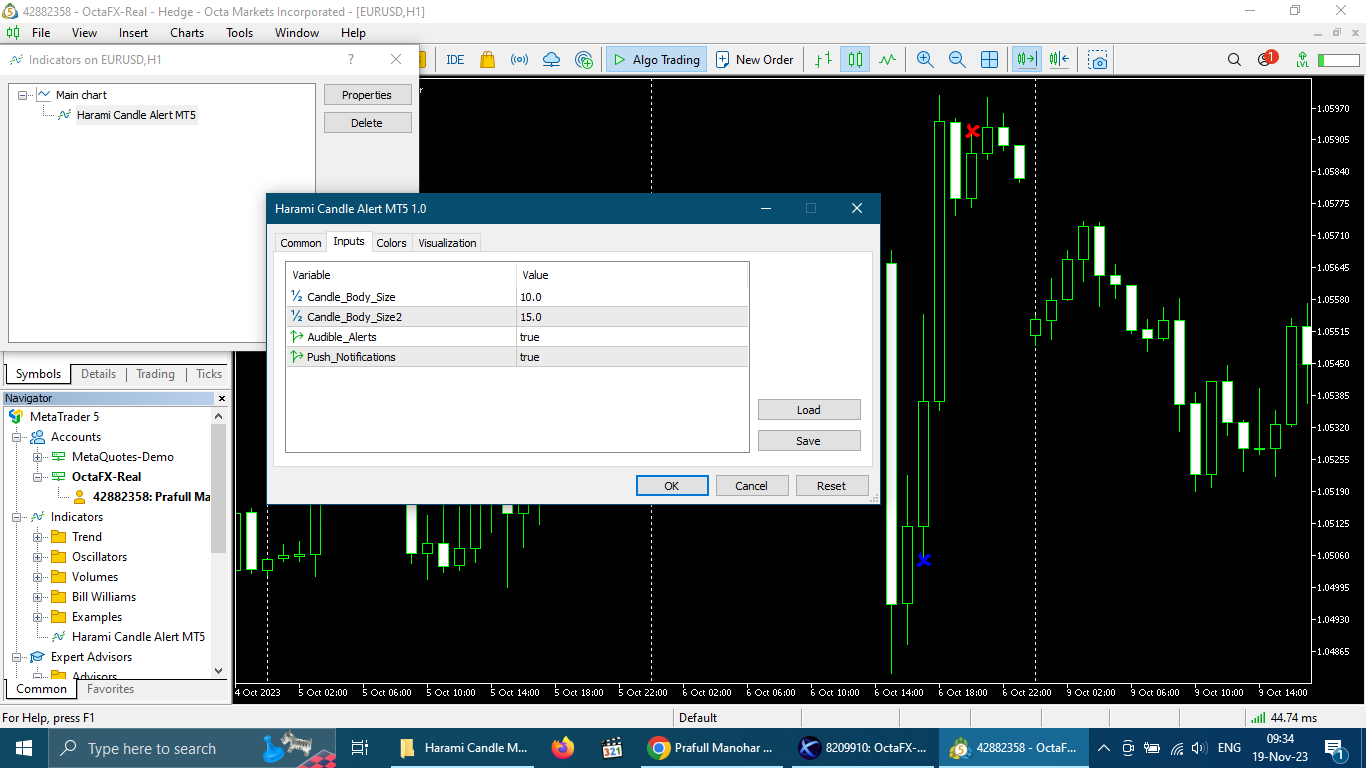
If you are using naked eyes to find candlestick patterns on your chart it's a good thing but it requires your time and attention and still you miss some patterns here and there. Don't worry! This indicator will help you to find "Harami Candlestick Pattern" on your chart very easily.
*Note: Default inputs are set for EURUSD H1 (1 hour) timeframe.
This is an alert system which gives you alerts whenever harami candlestick pattern happens. Types of alerts it can give you are:
1. Audible Alerts - This alert will popup on your chart (inside trading terminal) with sound.
2. Push Notifications - This will send you alerts on your Android or IOS mobile phones. (This feature requires MT4 or MT5 App installed on your mobile.)