The Hidden Gap Indicator MT5
- インディケータ
- Stephen Reynolds
- バージョン: 1.0
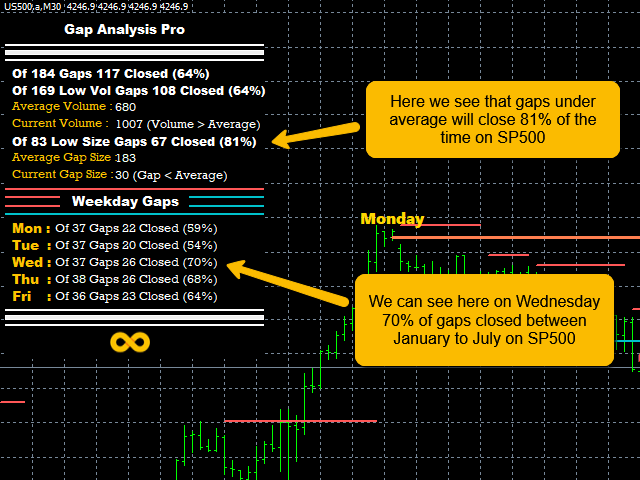
This Indicator is based on the Indice gaps between todays open price and yesturdays closing price. On Metatrader these are not shown as we only see a 24hr chart. If we want to know the gap between the open at 16:30 and yesturdays close at 23:30 on the SP500 this EA will reveal the gap. On Indices these types of Gap close approximately 60% of the time within the same day and is demonstrated on the panel which records previous gap closures and provides to the user a statistical proof of gaps closing for any Indice market its applied to.
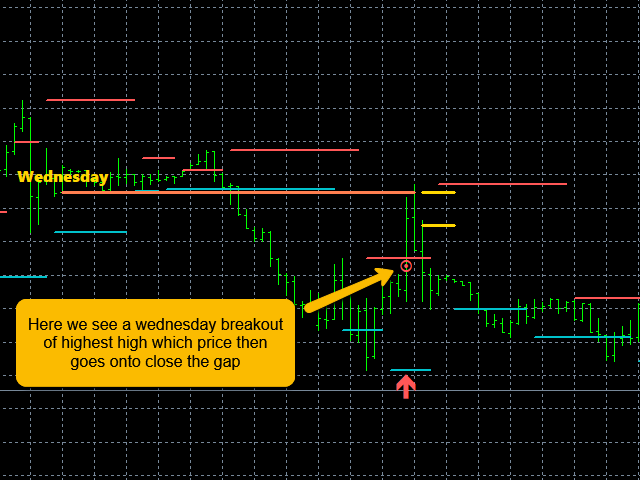
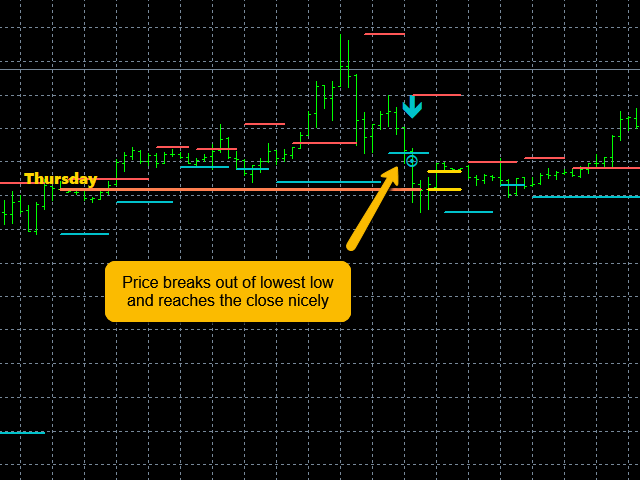
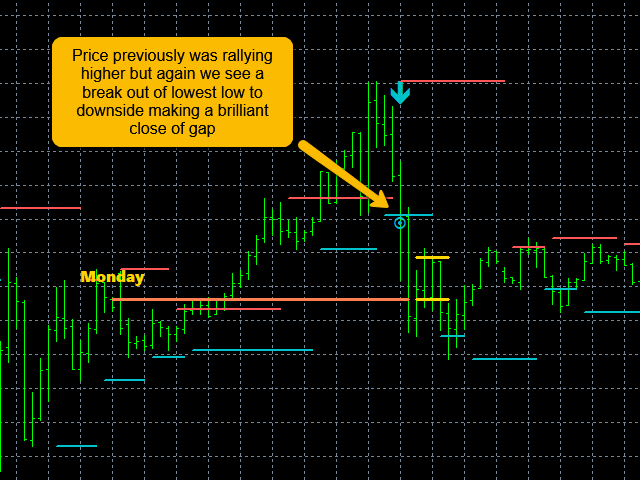
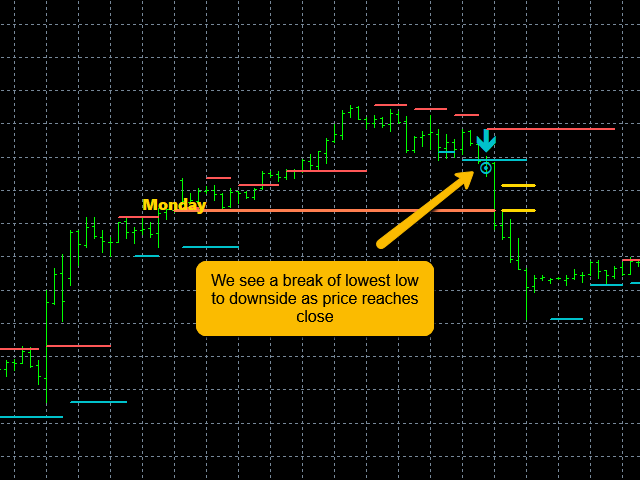
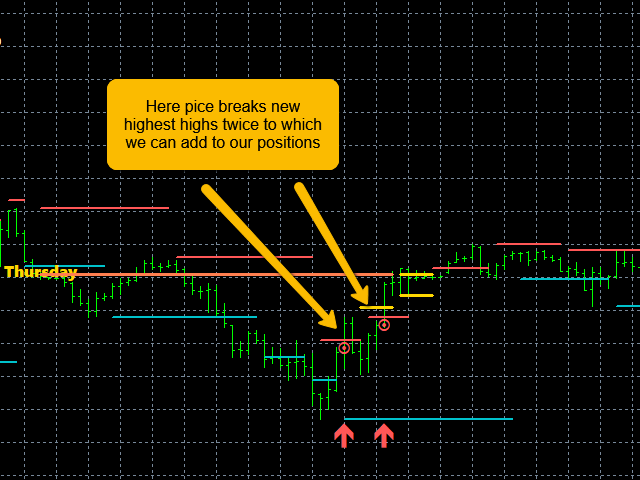
But also we need to know exactly when the gap will close. This I have discovered can be found when price breaks through a previous low for a down gap or breaks through a previous high for an up gap. Think about this! If price is breaking a new low and there's been a down gap it means price is bearish and will probably continue selling off till price reaches the close. Remember! As proven these gaps close 60% of the time. You can see all this for your self on backtest!
Thats how this EA gets its prediction of price direction and gives this system perfect timing for a truly remarkable strike rate.
When a gap occurs it draws a line projecting outward from yesturdays close to todays open then draws an entry arrow followed by 2 take profit lines based on the distance of current open to yesturdays close.
- Open system clear to see how and why it works!
- Unique gaps revealed, hidden by 24hr Chart
- High Probability trades! Indice Gaps combined with HiLo Break for solid entry
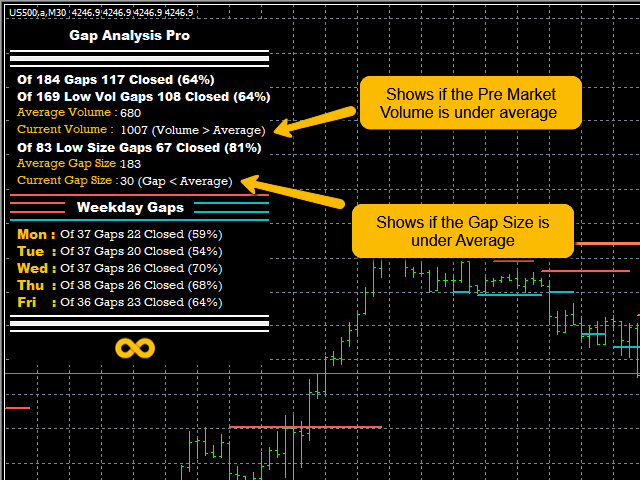
- Prove efficacy of system with stats on panel
- Follow the smart money
- Trading shouldnt be emotional but people are. EA's take the emotions away
- No martingale, grid averaging or no stop loss trading.
Settings :
Trade Management
- Order Type - There are 4 types to choose from Break Even, Partial Close, Trailing or Nothing
- Stop Loss Size - RR1to1 means if the take profit distance is 100 points then stop loss will also be 100. RR2to1 means if the take profit distance is 100 points then stop loss will be 200. There are 5 types 1-1, 2-1, 3-1, 4-1 and 5-1
- Trailing Stop To Minimum Profit - Points of profit before trailing stop begins
Volume & Gap Size
- Pre Market Low Volume - If true we will only signal and draw arrow on low volume
- Low Volume - If true we will only signal and draw arrow on low volume
- Medium Volume - If true we will only signal and draw arrow on Medium volume
- Pre Market Gap Size - If true we will only signal and draw arrow only on gap size
- Low Gap Size - If true we will only signal and draw arrow on low gap size
- Medium Gap Size - If true we will only signal and draw arrow on Medium gap size
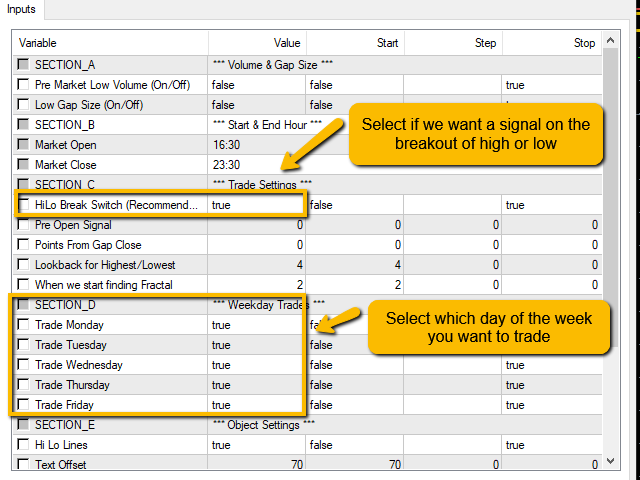
Start & End Hour
- Market Open - Todays Open
- Market Close - Yesturdays Close
Points Offset
- Points From Gap Close - Amount of points away from close to class as a signal EG if entry is too close its not worth trading
How To Trade :