JagzFX Relative Volume RVOL Indicator
- インディケータ
- JAGZFX LTD
- バージョン: 1.0
- アクティベーション: 10
What is the RVOL Indicator?
It is well established that volume (including tick volume) is a valuable indicator of trader commitment to a price movement. The challenge with using volume for intraday trading is that there is a general cycle of increasing and decreasing volume associated with the different regional trading sessions.
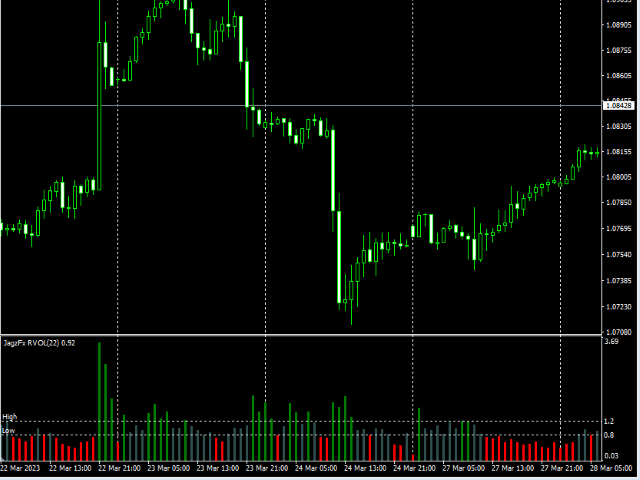
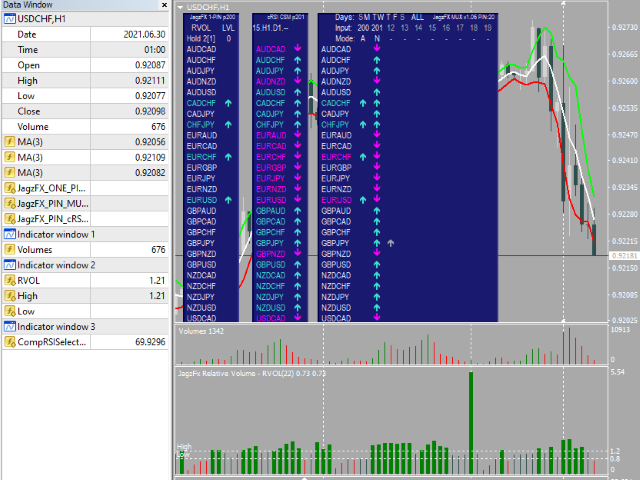
The Relative Volume, or RVOL, indicator helps to overcome this by comparing the current volume with the average volume for that time of day, calculated over a period of days.
RVOL indicator settings
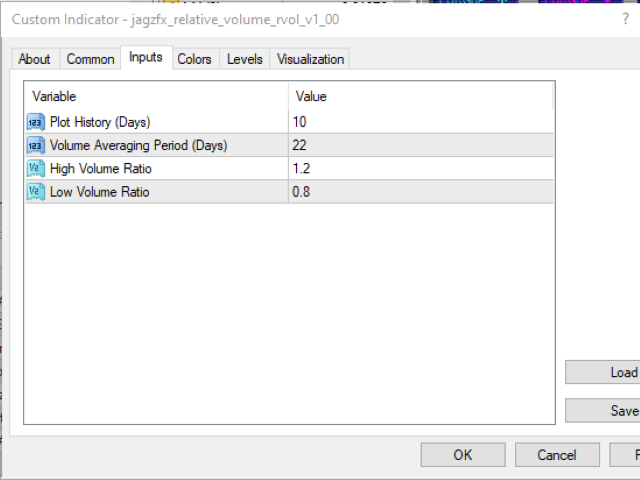
RVOL has only four settings, you should find the defaults are a good start for understanding the use of the indicator.
- Plot History (Days) sets the number of days back that the indicator is plotted on the chart. (Note: when using this indicator with JagzFx OnePin reducing this value to 1 will minimise MT4 CPU usage.
- Volume Averaging Period (Days) sets the number of days used to calculate the volume average. The default of 22 days is approximately one trading month.
- High Volume Ratio sets the level at which the volume is considered to be higher than average. The default of 1.2 means that the volume must be 1.2x or 120% of the average to be considered higher than usual.
- Low Volume Ratio sets the level at which the volume is considered to be lower than average
