Buffalo Trader BOT
- エキスパート
- Douglas Serra Braga Junior
- バージョン: 20.0
- アップデート済み: 9 8月 2023
- アクティベーション: 5
The Buffalo Trader BOT is the most complete QUANT solution on the market. With it you'll be able to create any strategy you want, and better, without tying yourself to specialist models that only perform specific tasks. With Buffalo, you will have a true ally for your operations, as you will have the freedom to define, test and train the best Quantitative Trading models using a single and powerful tool.
See what you can do with your Buffalo Robot
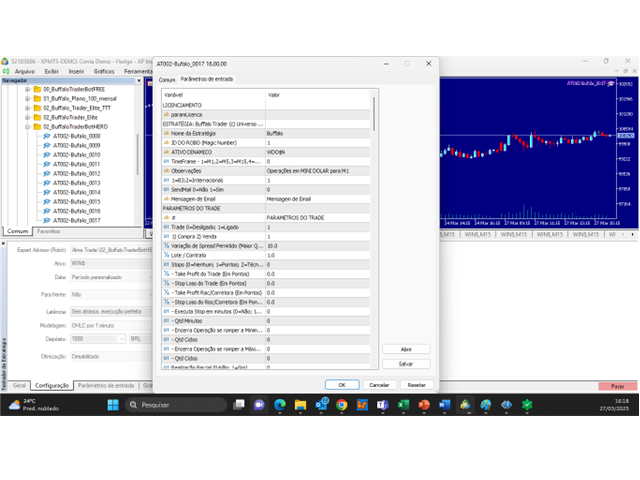
BASIC DEFINITIONS OF STRATEGY
- Define names for the strategy;
- Define Magic Number to be able to run multiple strategies using the same assets;
- Configure dynamic assets, so that the Robot changes assets on the chart if it is attached to the wrong chart;
- Sending Signal Warning Emails;
BASIC TRADE PARAMETERS
- Purchase or Sale;
- Spread Allowed;
- Volume;
- Take profit and stop loss in Points;
- Take profit and stop loss in Financials;
- Take profit and stop loss in Technical or Dynamically Calculated;
DEFINITION OF GOALS AND MANAGEMENT OF FINANCIAL RISKS
- Profit or loss target per Day;
- Profit or loss target per week;
- Profit or loss target per Month;
- Profit or loss target per Year;
TENDENCIES
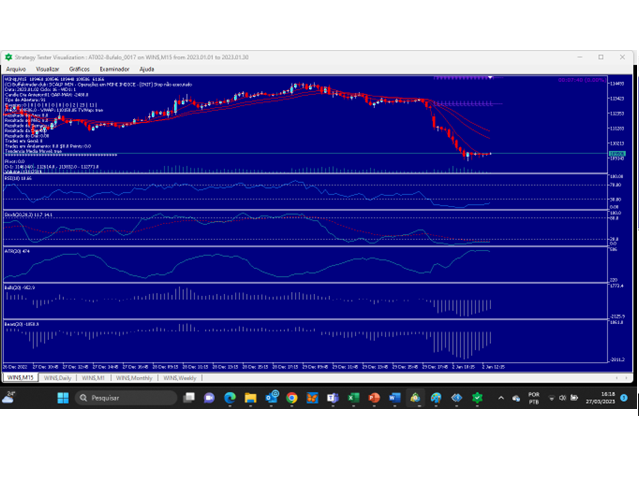
- Moving average and moving average slope;
- VWAP;
- Trend based on the opening price of the day, week or month;
TRADING EVENTS
- Breakthrough of the high or low of the current day;
- Breakthrough of the previous day's high or low;
- Breakout of the high or low of the previous candlestick;
- VWAP crossing;
- 3 Candles, which can be configured as 3 green, 3 red, 2 red and 1 green;
- Candle Formation per Second;
- Opening price crossover;
- Crossover of moving averages;
- RENKO, allowing to send signals through any Renko pattern;
- Maximum or minimum breakage of Cycles. Example: Breaking of the maximum of the last 51 candles;
- Sudden increase in volume;
- Quantum event. Occurs when a percentage of candles are green or red, which may indicate a strong trend or reversal;
- Time signal, to open order at some specific time;
TECHNICAL INDICATORS;
- Previous day GREEN OR RED;
- Market opening gap up or down;
- Support or Resistance;
- RSI;
- Stoch;
- ATR;
- Bull Power;
- Bear Power;
- Price Projection for future formation. Example: Triangle or pennant;
TRADE ZONES;
- Configuration of price zones where the EA may or may not operate;
EVENT SCHEDULE
In this session, the strategist will define the sequence of events that he will use to operate. Example: If there is a breakout of the previous candlestick followed by a moving medical crossover, open a buy trade;
Example:
- Event 01: Breakout of the previous candle high;
- Event 02: Moving average crossover;
SCHEDULE MANAGEMENT
In this session, the strategist will be able to define operating hours, closing orders at the end of the day, days of the week on which he will operate, etc...
ADDITIONAL SETTINGS
- Trade log: Have a true photograph of the moment a trade is executed, being able to generate future analyzes of indicators, prices, etc...
- Screen Log: Turning on or off information that will appear on the screen;
- In both logs above you will have the option to turn off to speed up your backtests;
