Trending Volatility System
- インディケータ
- Vitalyi Belyh
- バージョン: 1.10
- アップデート済み: 29 5月 2023
- アクティベーション: 7
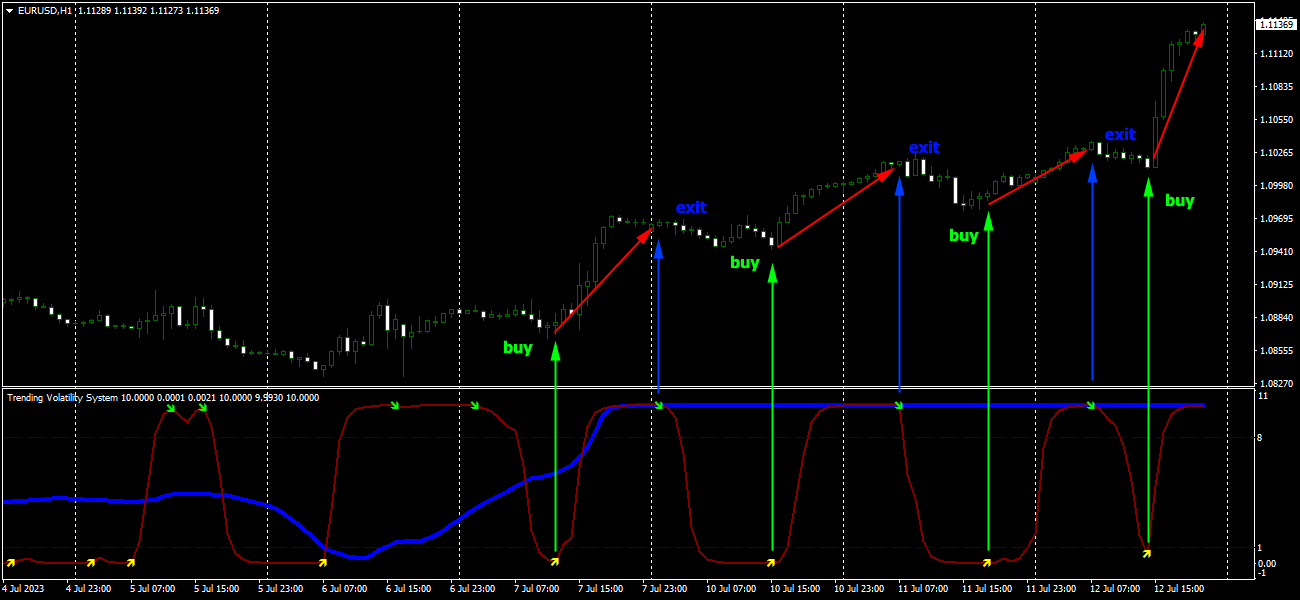
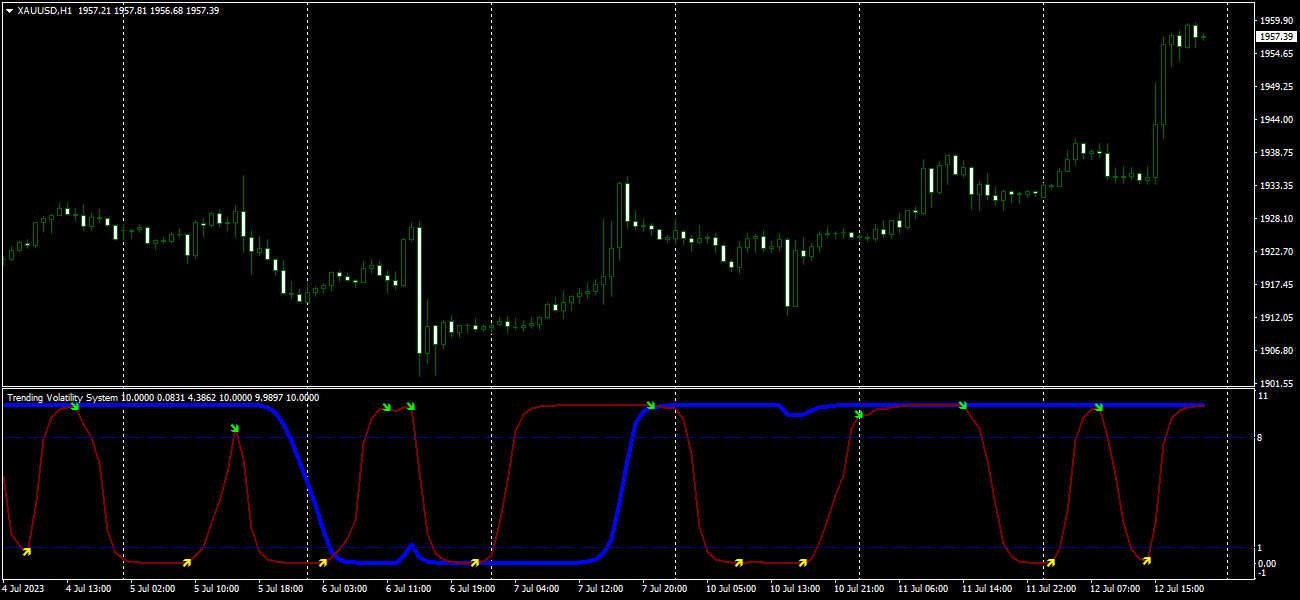
Volatility Trend System - a trading system that gives signals for entries. The volatility system gives linear and point signals in the direction of the trend, as well as signals to exit it, without redrawing and delays.
The trend indicator monitors the direction of the medium-term trend, shows the direction and its change. The signal indicator is based on changes in volatility and shows market entries.
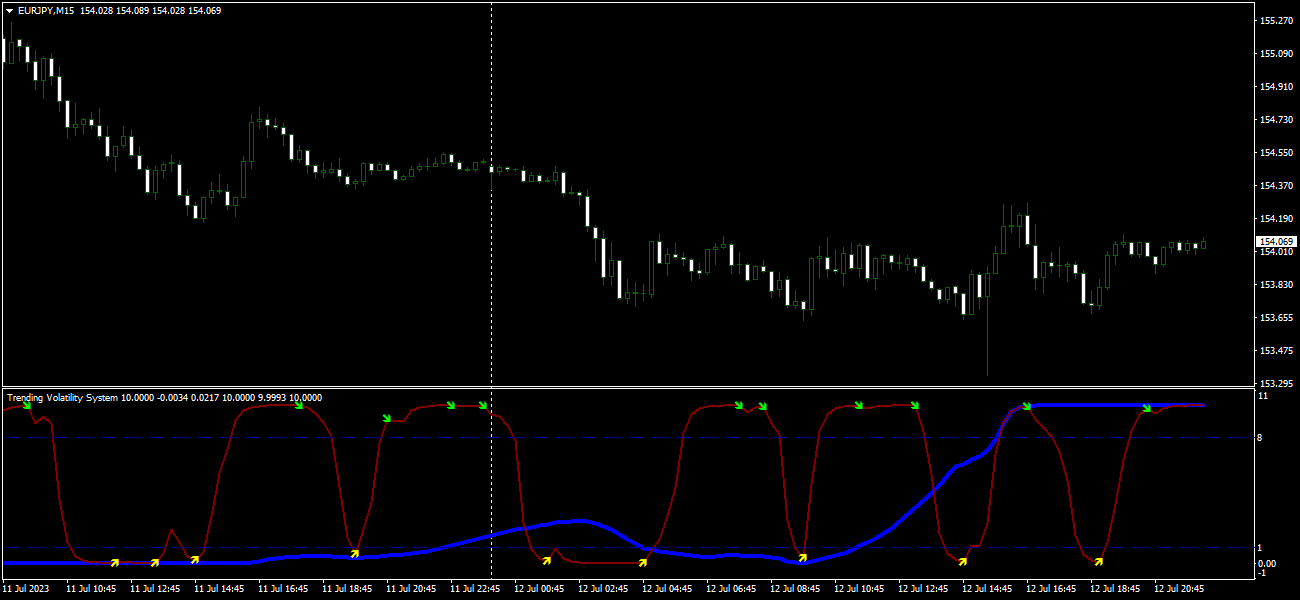
The indicator is equipped with several types of alerts. Can be applied to various trading instruments and time frames. Recommended Time Frames to use are M15, M30 and H1. To search for a more expected signal in the right direction, use the indicator on 2 Time Frames. If you have any questions about the use of the indicator - write in private messages. In the indicator, all parameters are already configured for use, except for the trend line.
Input parameters
The trend indicator monitors the direction of the medium-term trend, shows the direction and its change. The signal indicator is based on changes in volatility and shows market entries.
The indicator is equipped with several types of alerts. Can be applied to various trading instruments and time frames. Recommended Time Frames to use are M15, M30 and H1. To search for a more expected signal in the right direction, use the indicator on 2 Time Frames. If you have any questions about the use of the indicator - write in private messages. In the indicator, all parameters are already configured for use, except for the trend line.
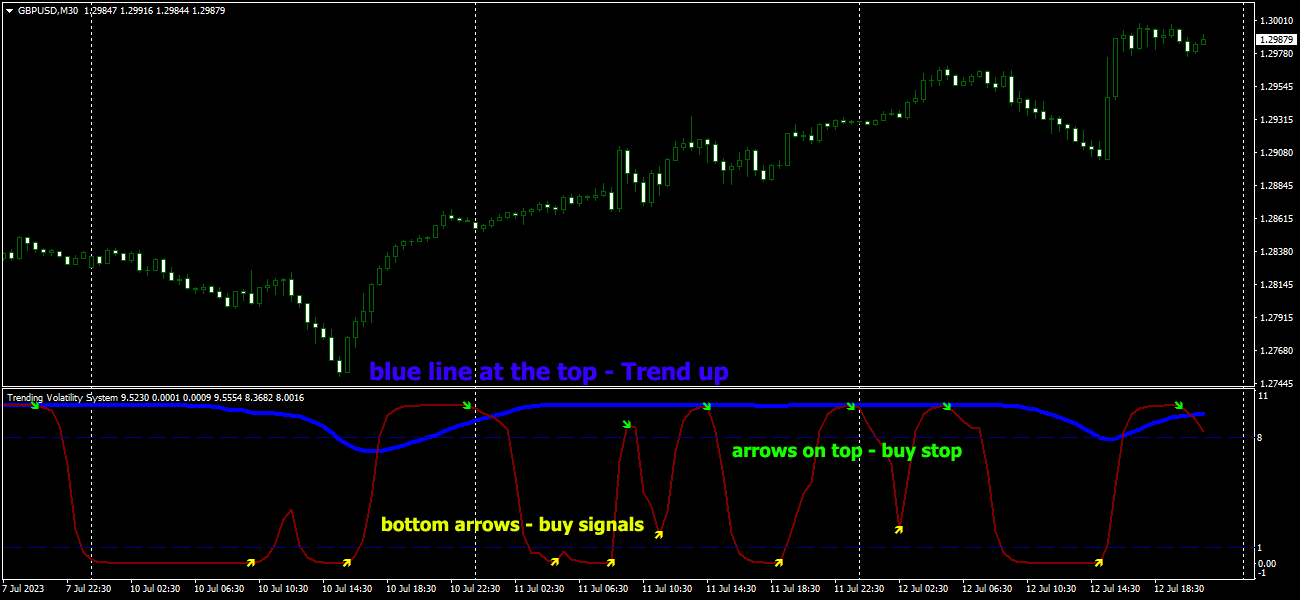
Buy: The trend line is above level 8 or below but is pointing up. The red signal line crosses level 1 or the Lower fractal point.
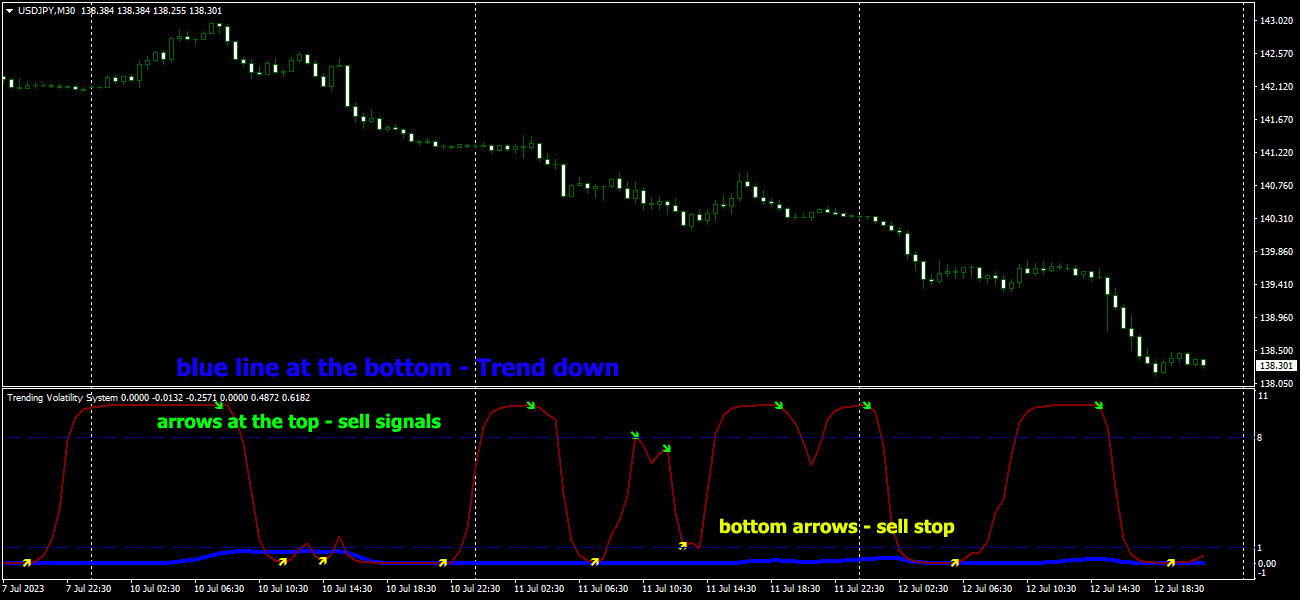
Sell: The trend line is below level 1 or above but is pointing down. The red signal line crosses level 8 or the Upper fractal point.
If the situation is controversial, switch to the higher Time Frame and follow its signals.
- Trend Period : The period of the blue trend line
- Line Period : Red signal line period
- number of bars on the chart : Number of indicator bars on the chart
- Play sound / Display pop-up message / Send push notification / Send email (true/false) : Use notifications when signal points appear.
- Sound file signal : Sound file for signals

Der Indikator hilft mir zusammen mit 2 anderen Indikatoren auf XAUUSD in der 1 min timeframe zu scalpen und mir Fehltrades zu minimieren