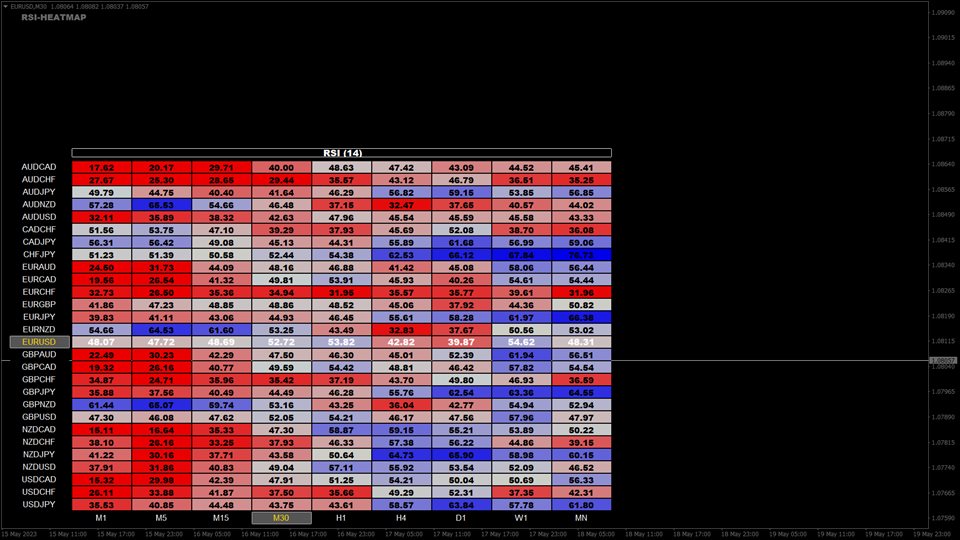
RSI heatmap
- インディケータ
- Mr Pimook Chokdamrongsuk
- バージョン: 1.1
- アップデート済み: 22 5月 2023
Welcome to the world of trading and technical analysis. In today's fast-paced markets, understanding market sentiment and identifying potential entry and exit points is crucial for
successful trading.
One essential tool in a trader's arsenal is the Relative Strength Index, or RSI. And now, we introduce the Free RSI Heat Map, a powerful visualization tool that brings RSI data to life.
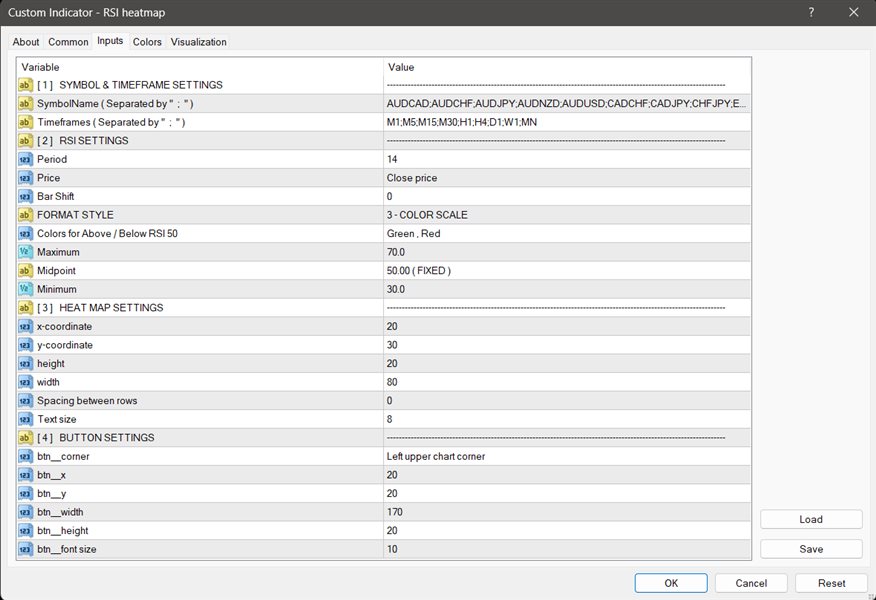
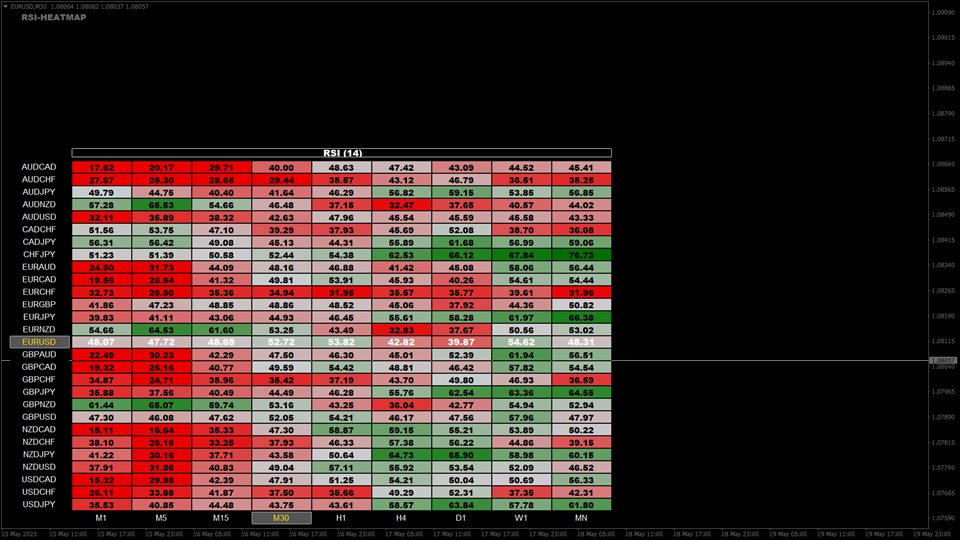
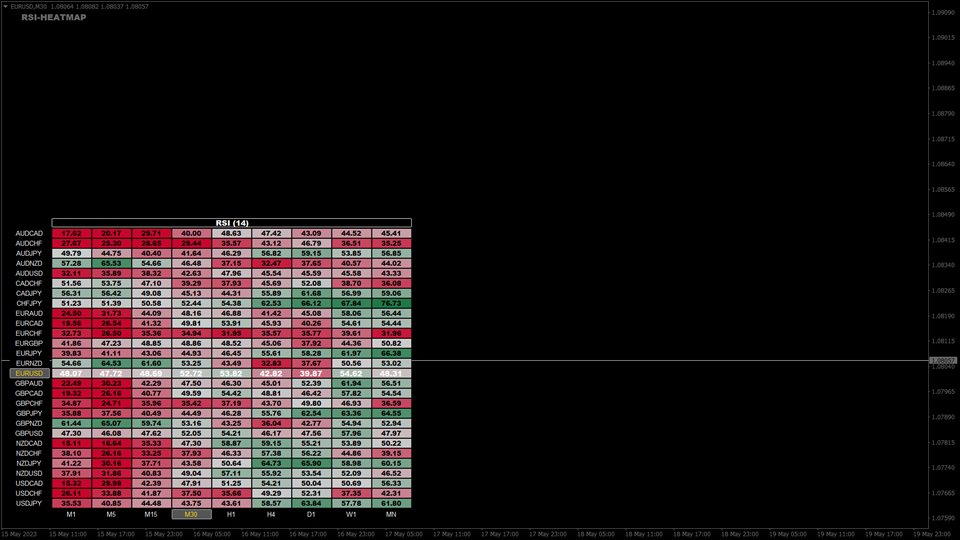
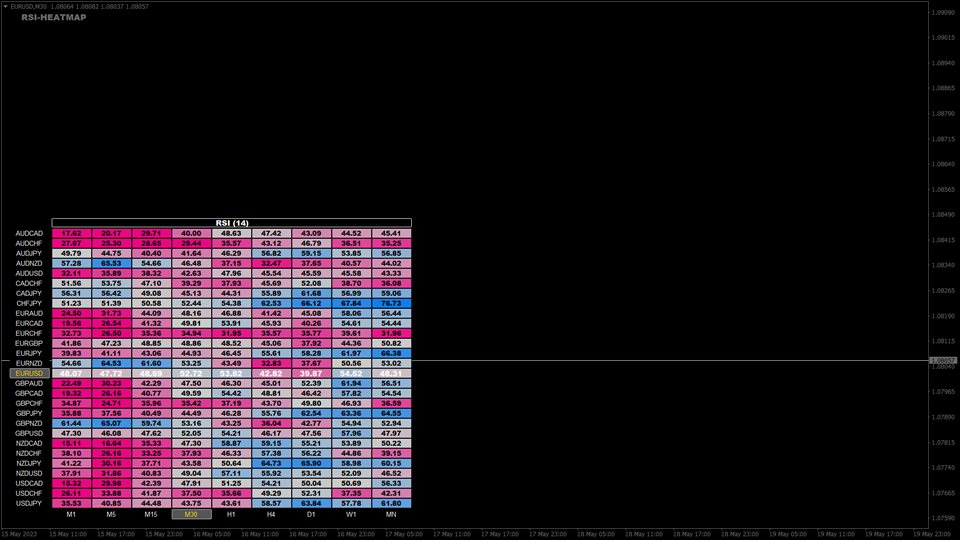
RSI Heat Map offers a comprehensive overview of the RSI values across multiple instruments, allowing traders to quickly identify overbought and oversold conditions.
It presents a visual representation of market strength or weakness, enabling informed trading decisions.

