AV Grid MT5
- インディケータ
- Anja Vivia Vogel
- バージョン: 1.10
- アップデート済み: 31 3月 2023
- アクティベーション: 5
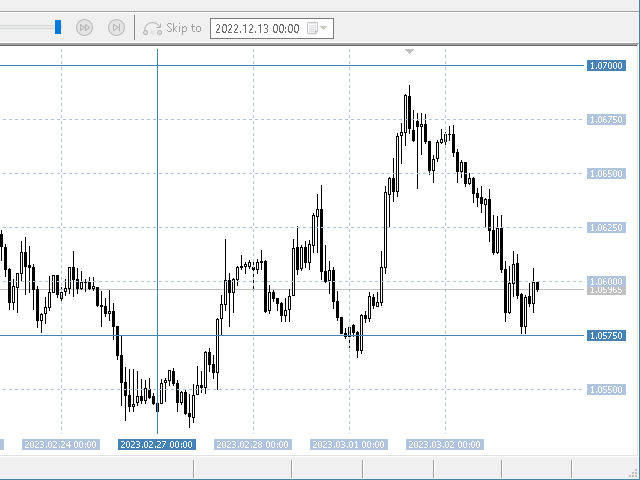
"AV Grid MT5" is an indicator for MetaTrader 5, which automatically displays round numbers as horizontal lines and a sensible period separation.
Round prices can be used as support and resistance in trading.
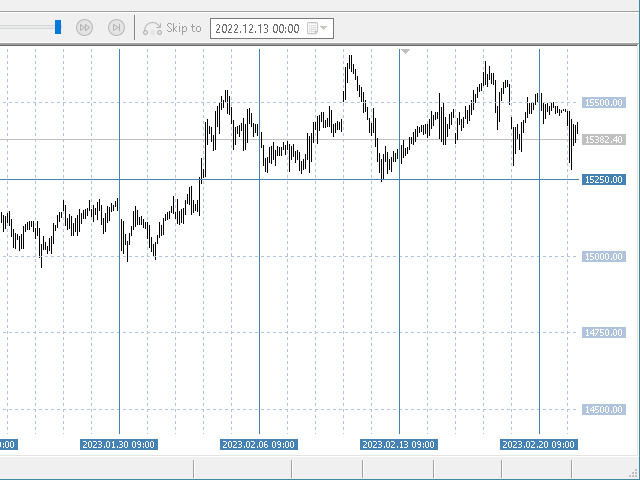
It is an improvement on the "Grid" setting, which also draws a grid on the chart.
Improvements:
- Round levels instead of arbitrary positioning of the horizontals
- Structure by highlighting all x lines (main lines, 2 or 5 makes sense)
- Vertical lines are each in two periods (main and intermediate lines) instead of arbitrary positioning
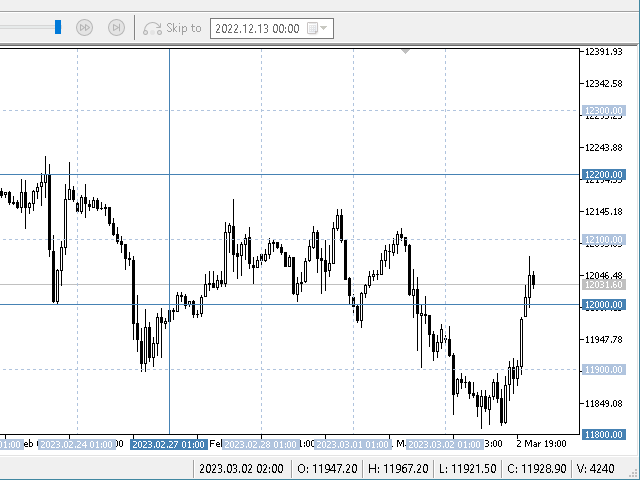
- Grid color and style of the lines are freely selectable (2 x horizontal + 2 x vertical)
- "Background" also causes the position label to be displayed (right and bottom)
- Tooltips of the lines can be switched on and off and show the position (price or date/time)
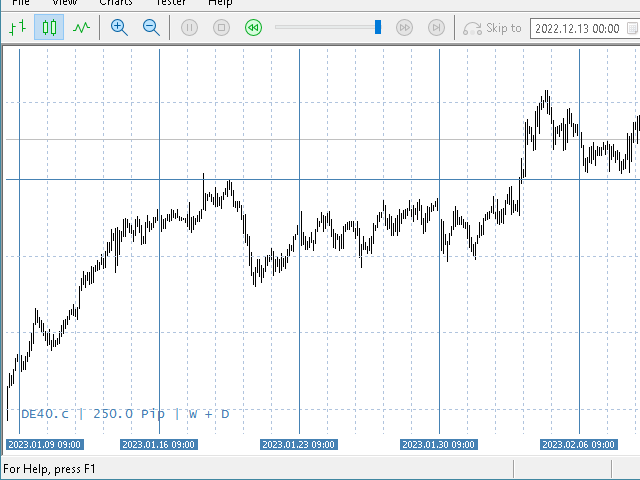
Abbreviations:
- Y10 = 10 years
- MN6 = 6 months
- W = 1 week
- D = 1 day
- H8 = 8 hours
The indicator calculates its own horizontal line spacing, so you don't have to constantly adjust them. A big advantage in my opinion.
By using the same foreground and background color in the chart with "Background" setting of all 4 line styles = false, you can create your own plain chart axes.
Please report bugs.
Round prices can be used as support and resistance in trading.
It is an improvement on the "Grid" setting, which also draws a grid on the chart.
Improvements:
- Round levels instead of arbitrary positioning of the horizontals
- Structure by highlighting all x lines (main lines, 2 or 5 makes sense)
- Vertical lines are each in two periods (main and intermediate lines) instead of arbitrary positioning
- Grid color and style of the lines are freely selectable (2 x horizontal + 2 x vertical)
- "Background" also causes the position label to be displayed (right and bottom)
- Tooltips of the lines can be switched on and off and show the position (price or date/time)
Abbreviations:
- Y10 = 10 years
- MN6 = 6 months
- W = 1 week
- D = 1 day
- H8 = 8 hours
The indicator calculates its own horizontal line spacing, so you don't have to constantly adjust them. A big advantage in my opinion.
By using the same foreground and background color in the chart with "Background" setting of all 4 line styles = false, you can create your own plain chart axes.
Please report bugs.