Scalper Channel MT5
- インディケータ
- Andrei Novichkov
- バージョン: 1.0
- アクティベーション: 5
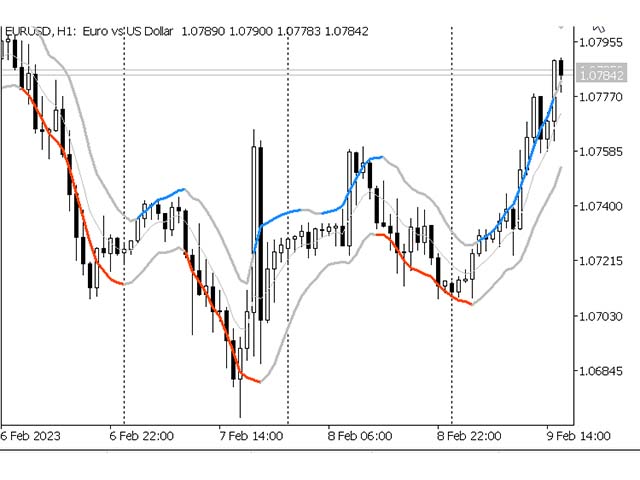
"Scalper Channel MT5" is a modern channel indicator that shows the trader the direction of the trade. For work, the indicator uses built-in and proprietary technical means and a new secret formula. Load it on the chart and the indicator will show you the entry direction in color:
The indicator has two main parameters:
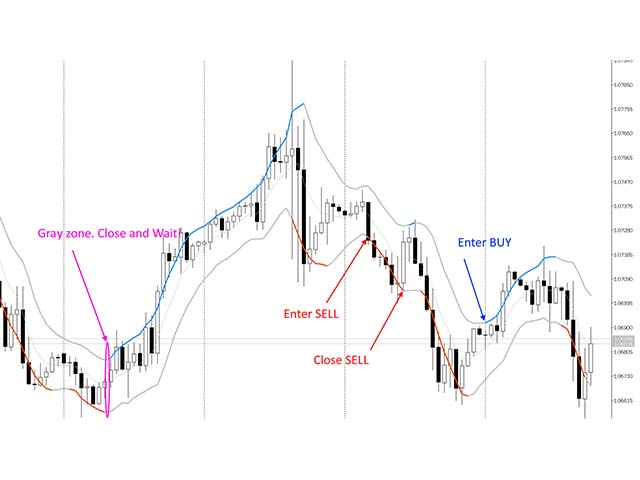
- If the upper limit of the price channel of the indicator is blue, open a buy position.
- If the lower limit of the price channel of the indicator is red, open a sell position.
- If the border of the indicator is gray, neutral - close the position and wait.
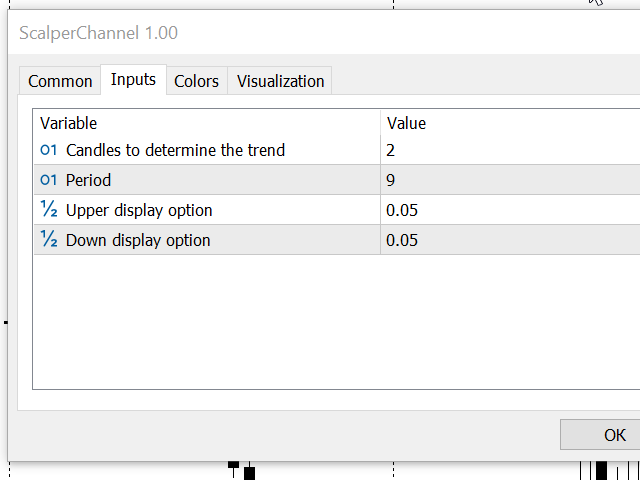
The indicator has two main parameters:
- Candles to determine the trend - the number of analyzed candles to determine the trend.
- Period – smoothing period.
The remaining parameters are responsible for the visual location of the price channel boundaries on the chart.
The package includes documentation in pdf format and an open source EA that demonstrates how to work with the indicator. ATTENTION! The Expert Advisor is not intended for real trading, but only for demonstration purposes. Where you can download the adviser and documentation will be indicated in my profile.
The MT4 version is here.