FTU Idioteque buy sell arrows
- インディケータ
- James Erasmus
- バージョン: 1.4
FTUイディオテック
このインジケーターはMT4プラットフォーム用で、単独で使用できますが、他のインジケーターや戦略と組み合わせるのが最適です。
macd、adxなどの様々なインジケーターを組み合わせて矢印を描き、エントリーやトレンド転換を示唆
YouTube で短い紹介ビデオをご覧ください: https://youtu.be/lCRJ3mFNyOQ
インジケーターの特徴:
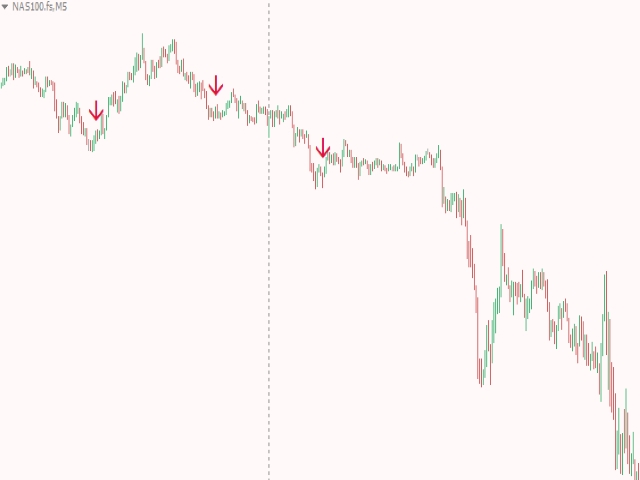
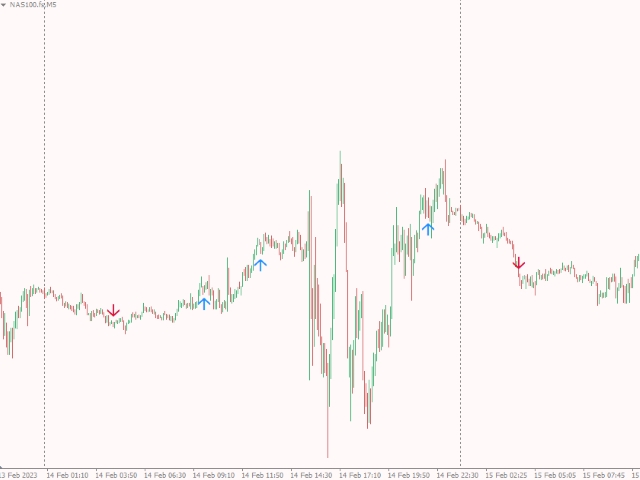
矢印の販売と購入
視覚と音による警告
トレンド継続 / 早期トレンド転換シグナル
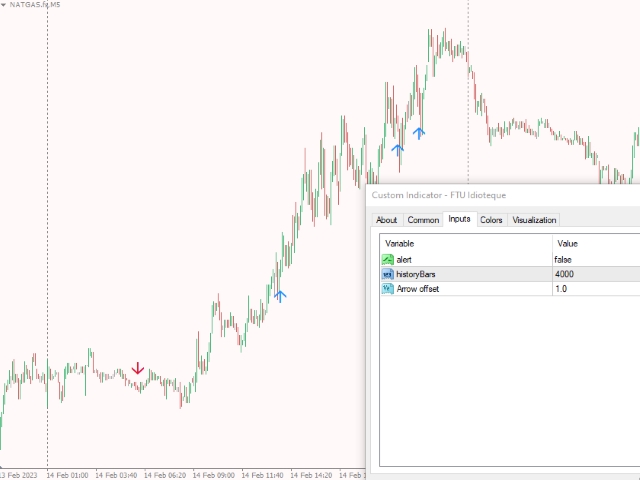
新機能:
履歴内のバーの数を制限する
バーから矢印までの距離を変更する
使用法: このインジケーターは、ほとんどの資産グループ、外国為替、商品、指数などで使用できます。
すべてのタイムフレーム、再描画なし、高速読み込み
私の FTU Predictor と組み合わせると、確実に優位性が得られます。
いくつかのアドバイス: 資金管理と規律が鍵であり、単一の戦略や指標が成功をもたらすことはありません。損失は発生するものであり、それをどのように回復するかを理解することが重要です。小さな勝ったり負けたりして、市場に恩返しすることがすべての日もあれば、勝ちが転がり込む日もあり、一貫性と忍耐が肝心です。取引商品とその長所と短所をできる限りよく理解する。変動性が高いのか、それとも小さな動きを生み出すのか、低スプレッド商品の場合はタイムフレームを短くする必要があります。取引規模を理解し、常に安全に取引し、それを念頭に置いた戦略を持っている場合は、別のアカウントでより多くのリスクを負います。練習とバックテストを行うことで、優れたトレーダーになります。
インストール ダウンロードすると、ファイルはインジケーター/マーケットに自動的に保存され、チャートにドラッグ アンド ドロップし、設定を調整します。
テストはデモで行うことができます - EA またはインジケーター用の mt4 シミュレーター mt4 シミュレーターでテストする方法については YouTube をご覧ください