The Market Structure Analyzer is a powerful tool designed for traders who follow market structure and smart money concepts. This comprehensive indicator provides a suite of features to assist in identifying key market levels, potential entry points, and areas of liquidity. Here's what it offers:
1. Swing High/Low Detection : Accurately identifies and marks swing highs and lows, providing a clear view of market structure.
2. Dynamic Supply and Demand Zones: Draws precise supply and demand zo
Was: $69 Now: $34 Blahtech VWAP - Volume Weighted Average Price (VWAP) is the ratio of price to total volume. It provides an average price over a specified time interval. Links [ Install | Update | Documentation ] Feature Highlights
Configurable VWAP Line Sessions, intervals, anchored or continuous Previous day settlement line Standard Deviation bands Alerts at bar close or real time Automatic Broker or Tick volumes Significantly reduced CPU usage
Input Parameters
Expert Advisor
Sentimento de Mercado é um indicador que usa os dados do nosso principal indicador: Market Strength Radar.: https://www.mql5.com/pt/market/product/114568?source=Site +Profile+Seller Ele imprime um gráfico de linhas que deve ser comparado com o gráfico de preço para entendermos o sentimento do mercado. As divergencias são pontos importantes de inflexão. As convergências mostram força da tendência atual.
Here is the boom and crash crazy Ma scalper a secretly coded color MA that is 1000% NON-REPAINT Works best on boom and crash 1000 Can be used on all timeframes from the 1 Minute timeframe to the Monthly timeframe The indicator is also a multi-time frame indicator you can select which timeframe to use The indicator is made for scalping purposes. as the trend changes the color of the indicator changes all well
Indicator LTS for MT5 (Level + Trends + Speed)
The LTS indicator was specially created for quick analysis of consolidations on the chart, which greatly facilitates decision-making when trading. LTS marks resistance and gives information about the forces affecting it, as well as the current speed and average travel. The indicator is easily customizable and can analyze any timeframe. LTS uses a unique trend analysis algorithm based on 4 parameters from global to local.
Simple and fast MACD oscillator with MACD and signal lines and two-color histogram.
I wasn't happy with the Meta Trader MACD oscillator as it's not immediate to read and the other ones I tried felt a bit laggy or added unneeded features on top, so I decide to make one that feels familiar to me. I hope you will find it useful!
Contact me for any issues or bugs and I will try to help the best I can.
Introducing Volume Orderflow Profile , a versatile tool designed to help traders visualize and understand the dynamics of buying and selling pressure within a specified lookback period. Perfect for those looking to gain deeper insights into volume-based market behavior! MT4 Version - https://www.mql5.com/en/market/product/122656/ The indicator gathers data on high and low prices, along with buy and sell volumes, over a user-defined period. It calculates the maximum and minimum prices during t
An invention that will turn your working principles upside down.
Especially in horizontal and stagnant markets, annoying losses can occur.
Besides, following trend lines, support and resistance can be tiring.
To put an end to all this, I decided to create a professional "moving average" indicator.
All you have to do is follow the colors.
If you need additional support, I recommend the "Heiken-Ashi" candle indicator in my profile.
I wish you lots of profit..
HAWA GOLD MT5 Advanced trading indicator with realistic pre-defined entry and exit levels with almost 80% win rate. The system focuses only Small and Steady Profits . It uses fixed stop loss for every signal to keep money management in place. As compare to other available indicators in market, HAWA gold has unique feature of displaying total profit and loss in terms of points where 1PIP=10points and Minimum profit is 10 pips. Its smart and advanced algorithm detects trend and trend strengt
"TPA Sessions" indicator is a very important tool to complement "TPA True Price Action" indicator . Did you ever wonder, why many times the price on your chart suddently turns on a position you can't explain? A position, where apparently no support or resistance level, or a pivot point, or a fibonacci level is to identify? Attention!!! The first run of the TPA Session indicator must be in the open market for the lines to be drawn correctly.
Please visit our blog to study actual trades wit
Do you use volume in your reading of the market?
Certainly many traders use it, and do not imagine operating without it.
The Color Histogram Volume Set indicator allows the user to choose the value that he considers interesting to monitor.
When you pass this you will have visual confirmation and if you want you will also have the audible alert that is given by the indicator.
Of course, there are other ways to try to find a high volume, such as assessing whether the volume
If you like this project, leave a 5 star review.
Follow on TikTok: @quantum.trader
[ Any Symbol Can Be ADDED ] DM me for adding any Pair symbol, crypto, index, stock or anything related. you can also DM me in TikTok [@quantum.trader] Works on [ EURUSD-GBPUSD-GBPJPY-USDJPY-XAUUSD-US30-BTCUSD-ETHUSD-SOLUSD ]
This indicator calculate and draw the Prediction or Forecast the peaks of the current day ( forecast high - forecast low - forecast middle - forecast upper q - forecast lower
Let us introduce you to a new era of neural indicators for financial markets! Intelligent Moving is a unique indicator that trains its neural network in real time! You no longer need to look for the optimal indicator parameters for each specific situation. No more late signals. The artificial intelligence is able to adapt itself and predict any market movements.
Visually, the indicator is drawn as a main solid moving average line, two dotted lines of standard deviations and signal arrows. For
Pipfinite creates unique, high quality and affordable trading tools. Our tools may or may not work for you, so we strongly suggest to try the Demo Version for MT4 first. Please test the indicator prior to purchasing to determine if it works for you. We want your good reviews, so hurry up and test it for free...we hope you will find it useful.
Combo Razor Scalper with Trend Laser Strategy: Scalp in the direction of the trend Watch Video: (Click Here)
Features Scalping indicator using a confir
Volume Profile Indicator used by professional Traders at Traders Inside Ltd. If you want to succeed in trading you need to know if current price is cheap, expensive or fair valued. Key features: Fair price (Point of control, POC), high and low price zones (POH, POL) POC in different timeframes for better orientation Symbol and timeframe Chart resize on open positions/orders, VPRmax/min Historic POC - see, how POC has changed the last periods Button to show/hide VPR
Calculated Bars (best results
A "Volume Profile" is an advanced charting indicator that displays total volume traded at every price level over a user specified time period. The main components of the volume profile are POC ( Point Of Control - the price level, at which the maximum number of contracts were executed during a selected period), VAH ( Value Area High - the highest price in the Value Area) and VAL ( Value Area Low - the lowest price in the Value Area).
When we settled on the original indicator, we spent a lot o
This MT5 indicator, Bull Bear Visual MTF V2, summarize the strength color graphic and percentages of power for both Bull and Bear in current market emotion stage which will show you in multi timeframes (21) and sum of the total Bull and Bear power strength which is an important information for traders especially you can see all Bull and Bear power in visualized graphic easily, Hope it will be helpful tool for you for making a good decision in trading.
Best Tested Pairs :- Step Index (Also can use on other pairs which spread is lowest)
How does the Magic Storm work
The Magic Storm will commence only if the Initial Trade becomes a losing trade. In case the initial trade is a
profitable one, or has been closed by the trader there is no need for the Magic Stormto be initiated.
Let’s assume that the initial trade was a 1 lot buy trade with Recovery Zone Range Pips is 50 and Recovery Zone Exit
Pips is 150 pips. The take profit fo
Introduction to Sideways Market Analyzer Notable period of Low volatility and non-trending movements in the financial market is considered as Sideways Market. Sooner or later, the low volatility will increase and the price will pick up a trend after Sideways Market. In terms of trading point of view, Sideways Market can serve as the very good entry timing for traders. Sideways Market is also quite often the representation of accumulation of large orders from big investors. Therefore, knowing the
Do you already know the Start Midas indicator?
What about the Vwap Standard Deviation indicator?
And I need to speak again in the book MIDAS Technical Analysis ...
The Start Midas SD Channel indicator combines the two in one, bringing the practicality and efficiency of Midas with the statistical calculation of the standard deviation.
All of this with the practicality of the White Trader Start indicators, where you can plot the indicator and move them on the screen using keyboard s
Choose the best trading tool: The impact of news on the exchange rate of a currency pair! As a news source you can use: Terminal calendar or Investing.com website In the second case, you will additionally need the Get News5 utility. The indicator combines well with the Trade maker utility, providing multi-currency trading. Calculates: indices of the impact of current news on currency pairs, taking into account market expectations. actual trend directions for 5 customizable timeframes and levels
Se considera la secuencia de la serie Fibonacci (2,3,5,8,13) que sera multiplicado por un periodo (11 o 33 o 70 etc.), de las 5 lineas se sacara una sola que sera contendrá el máximo y mínimo de las 5, a esta linea se le aplicara un suavizador de 3....y a esta linea suavizada se le volverá a aplicar un suavizador de 3. obteniéndose 2 lineas suavizadas. A simple vista se ve las intersecciones que hacen las lineas que pueden ser usadas para comprar o vender. Cambien se puede usar con apoyo de otro
The indicator displays peak levels of activity formed by the maximum volume, tracks the correlation of the candles on all timeframes (from the highest to the lowest one). Each volume level is a kind of key trading activity. The most important cluster is inside a month, week, day, hour, etc.
Indicator operation features A volume level receives Demand status if the nearest volume level located to the left and above has been broken upwards. A volume level receives Supply status if the nearest vol
Was: $249 Now: $99 Market Profile defines a number of day types that can help the trader to determine market behaviour. A key feature is the Value Area, representing the range of price action where 70% of trading took place. Understanding the Value Area can give traders valuable insight into market direction and establish the higher odds trade. It is an excellent addition to any system you may be using. Inspired by Jim Dalton’s book “Mind Over Markets”, this indicator is designed to suit the
Mean Reversion Supply Demand Indicator Mean Reversion Supply Demand is the indicator to detect the important supply demand zone in your chart. The concept of supply demand trading relies on the quantity mismatching between buying and selling volumes in the financial market. Typically, supply demand zone serves to predict the turning point. The wave pattern, for any supply demand zone to work as an successful trade, looks like the price must touch the base zone, move away and then return to zone
The S&P 500 Scalper Advisor is an innovative tool designed for traders who want to successfully trade the S&P 500 Index. The index is one of the most widely used and prestigious indicators of the American stock market, comprising the 500 largest companies in the United States. Peculiarities: Automated trading solutions: The advisor is based on advanced algorithms and technical analysis to automatically adapt the strategy to changing market conditions. Versatile approach: The advisor combine
Was: $299 Now: $99 Supply Demand uses previous price action to identify potential imbalances between buyers and sellers. The key is to identify the better odds zones, not just the untouched ones. Blahtech Supply Demand indicator delivers functionality previously unavailable on any trading platform. This 4-in-1 indicator not only highlights the higher probability zones using a multi-criteria strength engine, but also combines it with multi-timeframe trend analysis, previously confirmed swings
Imagine the ability to have Volume Speed second by second presented to you in the form of a speedometer... Well, imagine no more... Welcome to the new Minions Labs creation: Volume Speedometer . Volume Speedometer is a Minions Labs idea that was born trying to show in realtime what is happening with the Volume Flow of orders (or Ticks, if you don't have that) during the day. This indicator was created to be used in Intraday trading and the goal is to give you a "heads up" when the Volume flow is
WHY IS OUR FXACCCURATE LS MT5 THE PROFITABLE ? PROTECT YOUR CAPITAL WITH RISK MANAGEMENT
Gives entry, stop and target levels from time to time. It finds Trading opportunities by analyzing what the price is doing during established trends. POWERFUL INDICATOR FOR A RELIABLE STRATEGIES
We have made these indicators with a lot of years of hard work. It is made at a very advanced level.
Established trends provide dozens of trading opportunities, but most trend indicators completely ignore them!
TPA True Price Action indicator reveals the true price action of the market makers through 100% non-repainting signals strictly at the close of a candle!
TPA shows entries and re-entries, every time the bulls are definitely stronger than the bears and vice versa. Not to confuse with red/green candles. The shift of power gets confirmed at the earliest stage and is ONE exit strategy of several. There are available now two free parts of the TPA User Guide for our customers. The first "The Basics"
The Price Action Finder Multi indicator is an indicator of entry points that searches for and displays Price Action system patterns on dozens of trading instruments and on all standard time frames: (m1, m5, m15, m30, H1, H4, D1, Wk, Mn). The indicator places the found patterns in a table at the bottom of the screen. By clicking on the pattern names in the table, you can move to the chart where this pattern is located. Manual (Be sure to read before purchasing) | Version for MT4 Advantages
1. Pa
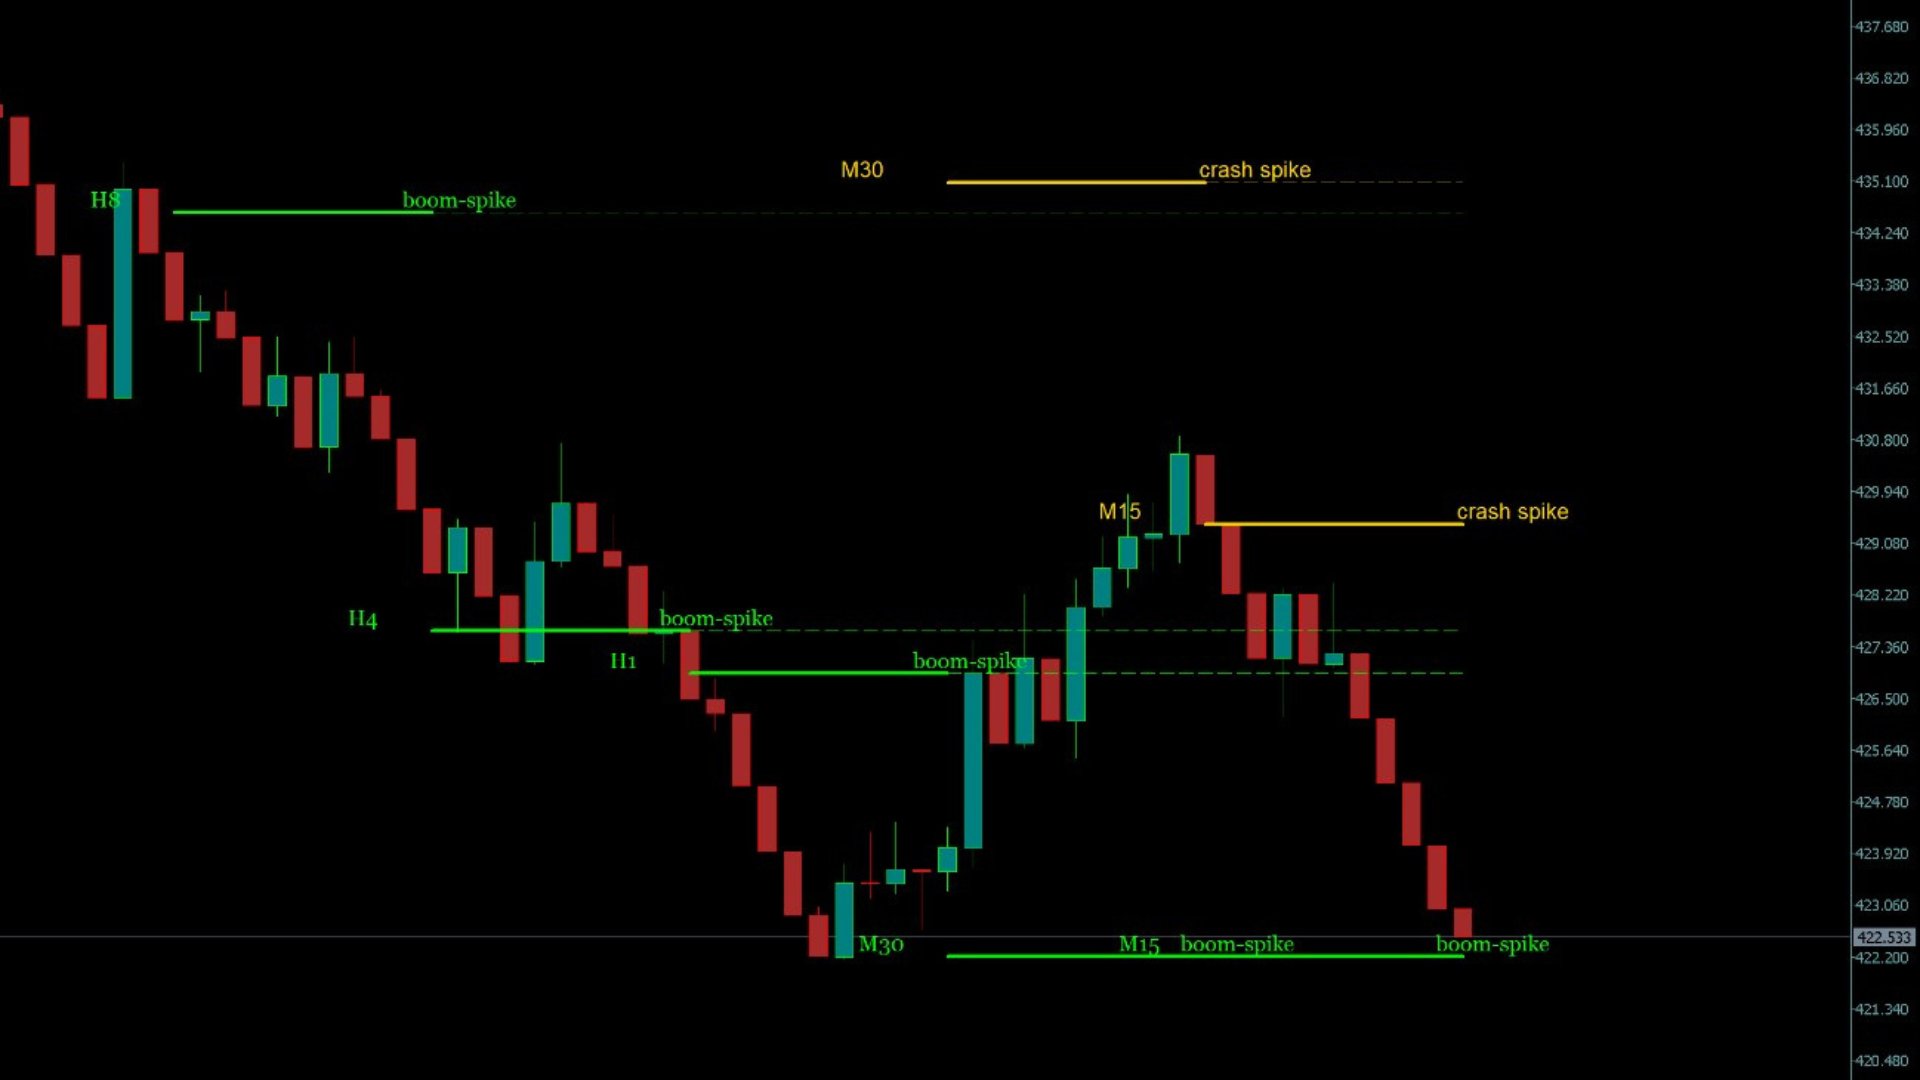
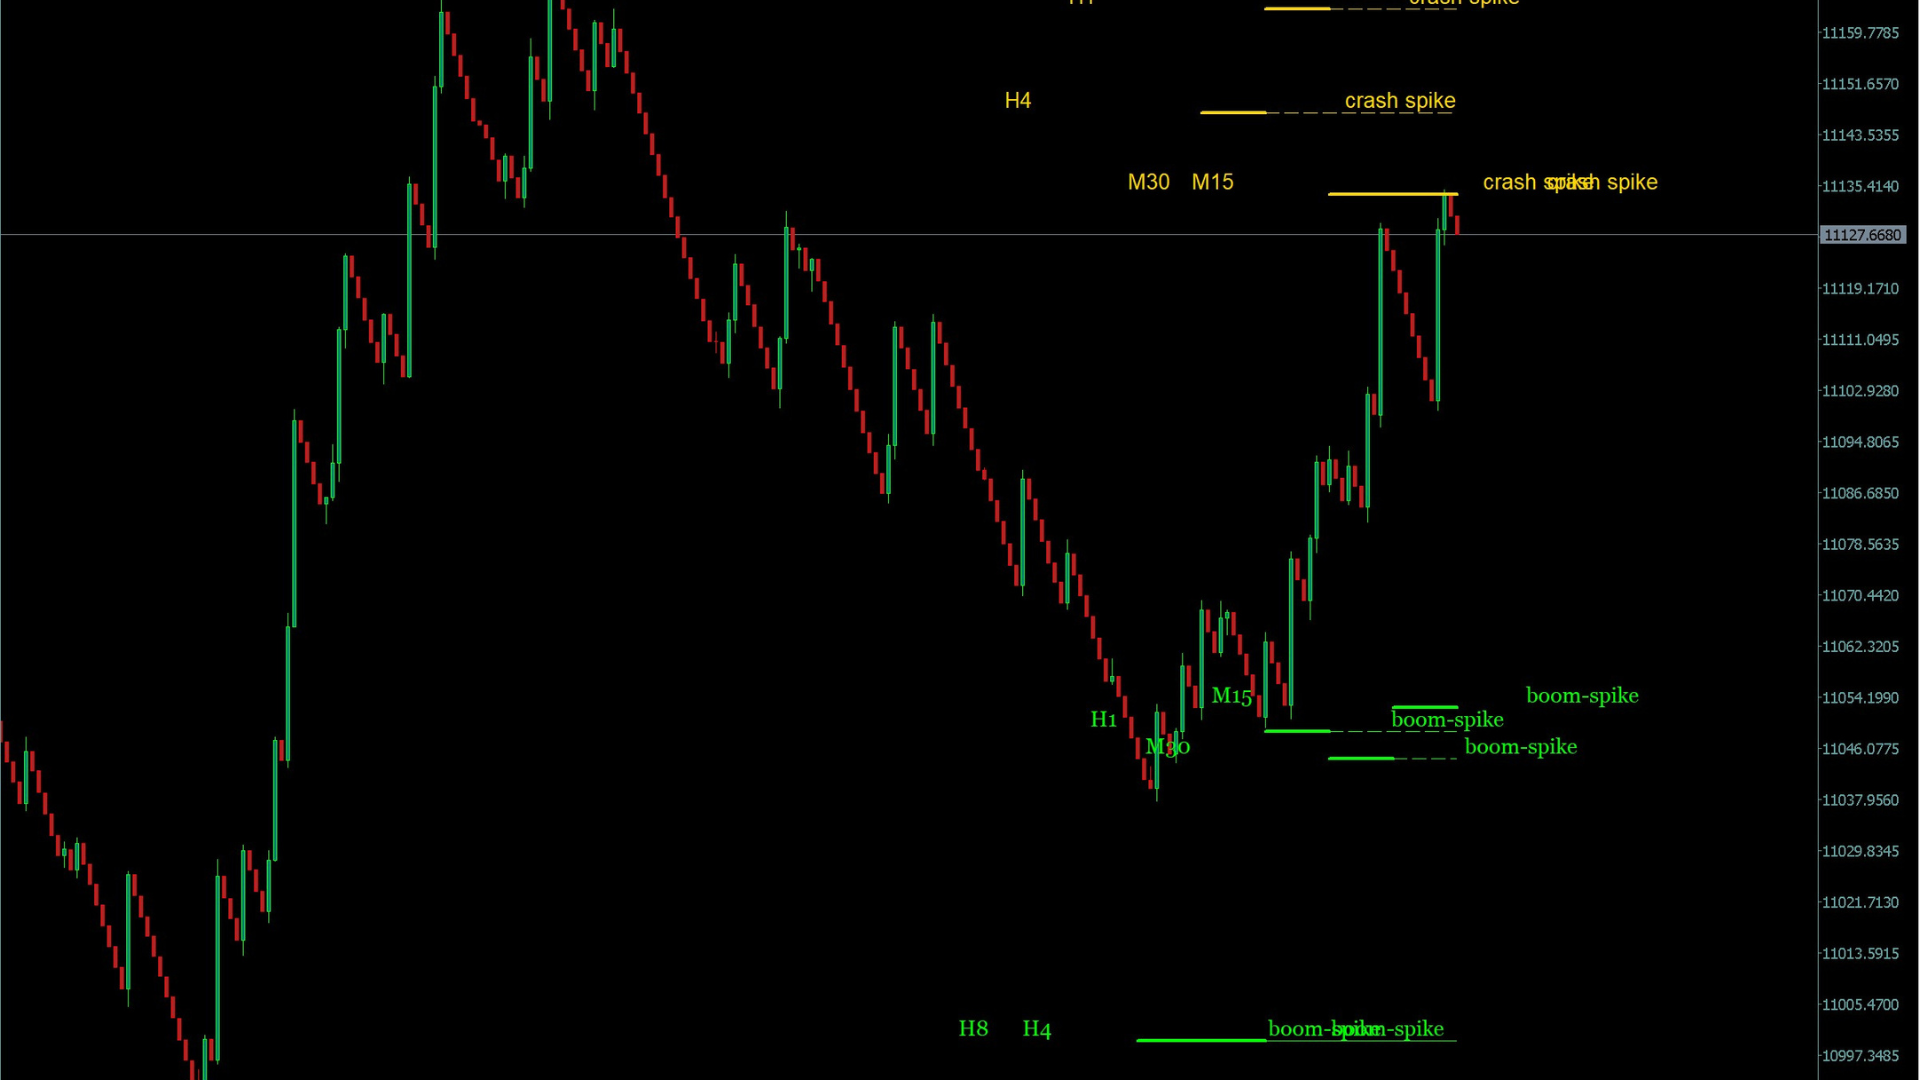
Golden Spikes Detector Acknowledgement and Dedications: The name of this indicator was Inspired by an Original; Mr Grant Koopman; a Knowledgeable and experienced Synthetics trader. I dedicate this indicator to Mr Grant.
Overview: The Golden Spikes Premium is a groundbreaking trading indicator meticulously crafted for the Boom and Crash indices on the Deriv market. Tailored to meet the needs of discerning traders, this powerful tool operates exclusively on the one-minute timeframe, providin
Did You Have A Profitable Trade But Suddenly Reversed? Exiting a trade is equally important as entering! Exit Scope helps maximize your current trade profit and avoid turning winning trades to losers.
Attention Exit Signals are NOT to be used in entering a trade! Exit means closing your trades to avoid correction/reversal which can wipe out existing profit or haunt break-even orders. Please watch presentation (Click Here)
Features Generates instant exit signals based on price action, volat
Gartley Hunter Multi - An indicator for searching for harmonic patterns simultaneously on dozens of trading instruments and on all possible timeframes. Manual (Be sure to read before purchasing) | Version for MT4 Advantages 1. Patterns: Gartley, Butterfly, Shark, Crab. Bat, Alternate Bat, Deep Crab, Cypher
2. Simultaneous search for patterns on dozens of trading instruments and on all possible timeframes
3. Search for patterns of all possible sizes. From the smallest to the largest
4. A
Bill Williams Advanced is designed for automatic chart analysis using Bill Williams' "Profitunity" system. The indicator analyzes four timeframes at once.
Manual (Be sure to read before purchasing)
Advantages
1. Automatically analyzes the chart using the "Profitunity" system of Bill Williams. The found signals are placed in a table in the corner of the screen.
2. Equipped with a trend filter based on the Alligator indicator. Most of the system signals are recommended to be used only accordi
The Currency Index indicator enables traders to display any index of eight major currencies. It uses a special calculation that considers specific currency pairs and their weights.
The default weights are based on the BIS Triennial Central Bank Survey results. Because of this advantage, the trader can see each currency's true strength and weakness.
Note: If the indicator is used in Strategy Tester (demo version), please keep in mind that all currency pairs' data must be downloaded in H
This indicator recognizes all support and resistance levels. A number of unique high-performance techniques have been applied, which made the existence of this indicator possible.
All formed channels are naturally visible: horizontal linear linear parabolic cubic (Polynomial 3 degrees - Wave) This is due to a bundle of approximating channels. The formed channels form "standing waves" in a hierarchical sequence. Thus, all support and resistance levels are visible.
All parameter management is
Level Breakout Indicator is a technical analysis product that works from upper and lower boundaries, which can determine the direction of the trend. Works on candle 0 without redrawing or delays.
In its work, it uses a system of different indicators, the parameters of which have already been configured and combined into a single parameter - “ Scale ”, which performs gradation of periods.
The indicator is easy to use, does not require any calculations, using a single parameter you need to selec
El indicador "Time Broker Deriv" está diseñado específicamente para su uso en los índices sintéticos Boom y Crash, así como en otros pares de trading disponibles en la plataforma MT5. Su función principal es proporcionar la hora del broker en comparación con nuestra hora local. Es importante destacar que el indicador "Time Broker Deriv" solo muestra la hora del broker.
"Volality 75 Boom Crash VIX" is an advanced analysis tool designed to identify key breakout zones in volatile asset pairs and boom crashes. Its focus is on highlighting moments of high volatility in the market.
This indicator is perfect for both scalping and swing trades.
"Volality 75 Boom Crash VIX is not just an indicator, but a trading strategy in itself.
The most recommended timeframe for using the indicator is 15M MINUTES.
The breakout levels represent the balance between bullish a