ZigZag with Extras for MT4
- インディケータ
- Fernando Carreiro
- バージョン: 2.0
- アクティベーション: 20
(Google 翻訳)
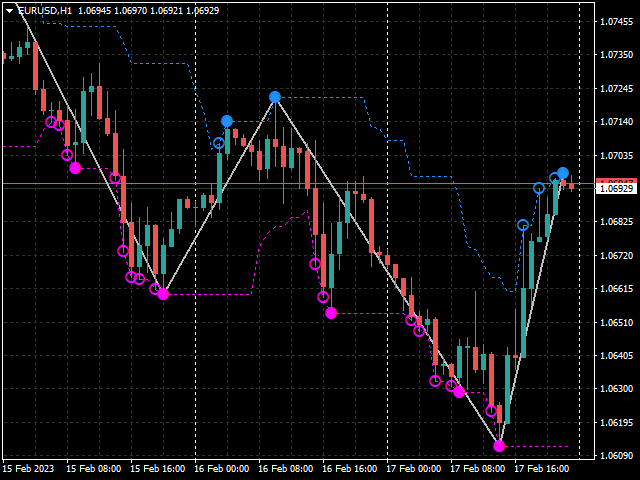
この指標は、MetaTrader インストールのソース コード例として提供されている元の ZigZag に基づいています。
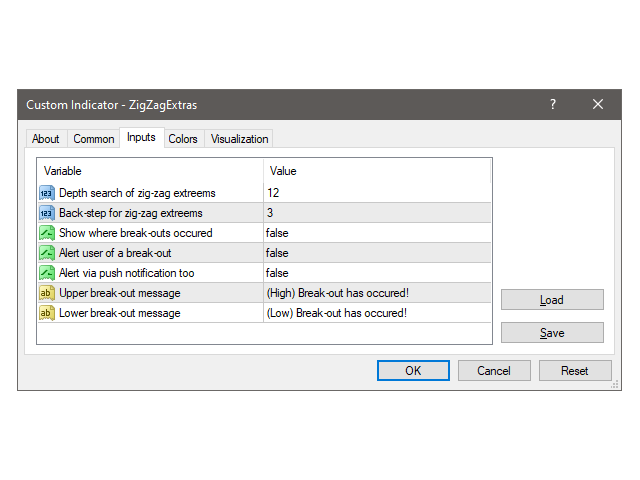
「深さ」チャネルとそれぞれのブレークアウトを表示するための追加機能を追加して書き直しました。 また、以前のジグザグ ポイントを観察することもできます。
オプションで、ブレークアウトが発生したときにユーザーに警告することができます。 アラートは端末上に表示することも、モバイル デバイスのプッシュ通知を介して独自のカスタム テキストで表示することもできます。
(Original text)
This indicator is based on the original ZigZag provided as a source code example with MetaTrader installations.
I rewrote it with some extra features for displaying the “depth” channel and the respective break-outs. It also allows one to observe prior zig-zag points.
Optionally, it can alert the user when break-outs occur. The alerts can be simply on the terminal or also via push notifications on a mobile device, with your own custom text.