ATS Volume Break Out
- インディケータ
- Andy Ismail
- バージョン: 108.119
- アップデート済み: 26 8月 2019
- アクティベーション: 5
Alpha Trend Spotter (ATS) Volume Break Out
This is an indicator that combines Volume breakout/breakdown and Moving Average Breakout/breakdown.
It is able to predict further price changes. It is not repainted, not recalculated. All lines are shown at the open of a new candlestick, never winking or vanishing in the current candle. These lines are appeared at the beginning of the current candle.
Suitable for M5 to D1 Timeframe.
How to Use:
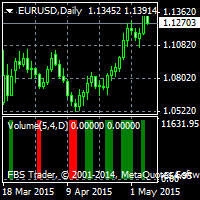
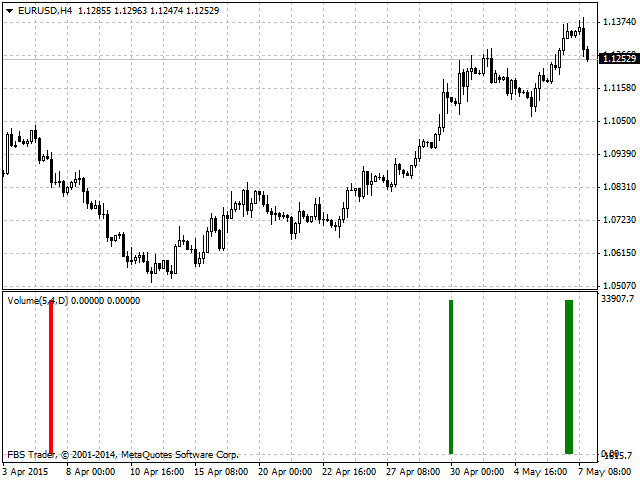
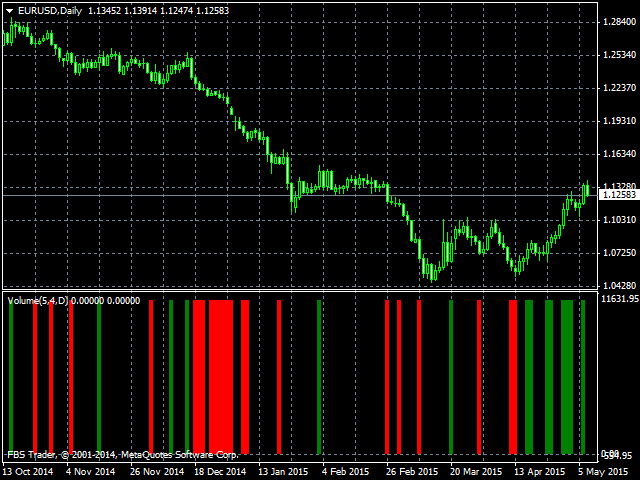
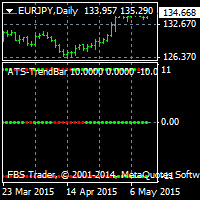
If Green line appears, that shows the "oversold" area, so then prepare yourself for the BUY opportunity.
If Red line appears, that shows "overbought" area, so then prepare yourself for the SELL opportunity.
