Trend Fibonacci
- インディケータ
- Krystof Zak
- バージョン: 1.0
Trend Fibonacci is a unique indicator that combines a power of Fibonacci sequences and ranges.
Channel Group: Click Here
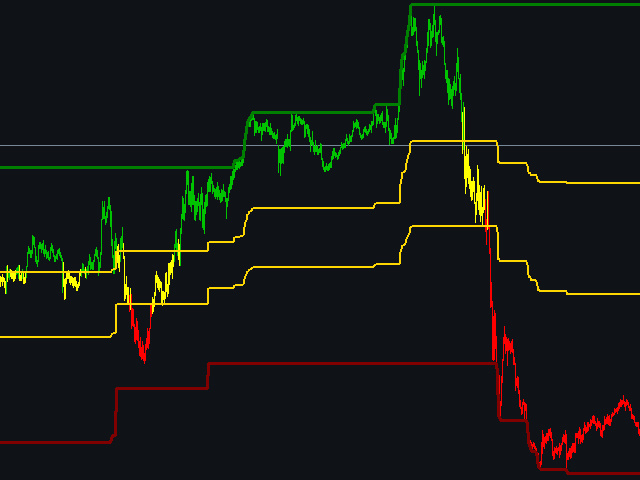
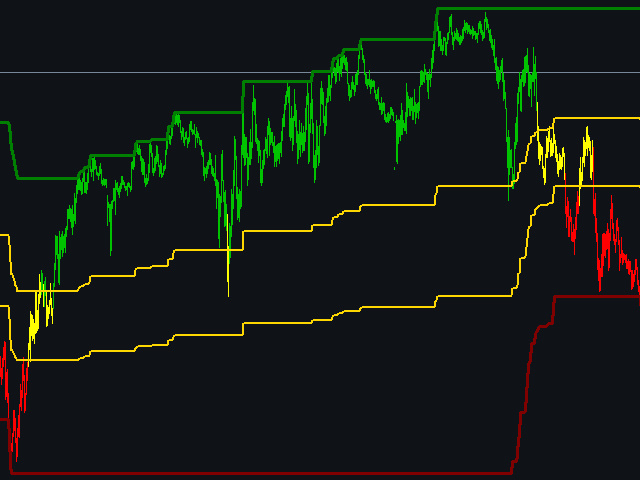
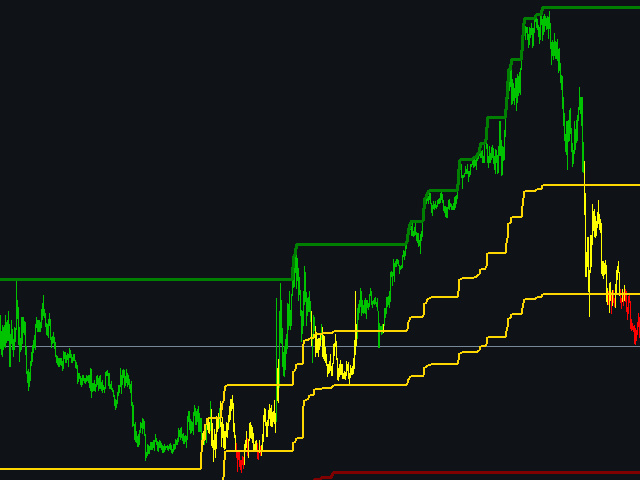
How to read:
- There are three zones --> red, gold and green
- Red candlestick = downtrend
- Green candlestick = uptrend
- Gold candlestick = no established trend
Inputs:
Per = number of bars used for calculations
FirstRatio = first Fibonacci ratio (Or use any ratio you want)
SecondRatio = second Fibonacci ratio (Or use any ratio you want)
!! IF YOU PURCHASE THE INDICATOR, CONTACT ME FOR FURTHER SUPPORT!!