• 概要
  • レビュー
  • コメント
  • 最新情報

UR PulseScalp MT5

UR パルススカルプ MT5
ペースの速い市場で究極の優位性を求めるスキャルパー向けの調整済み取引指標

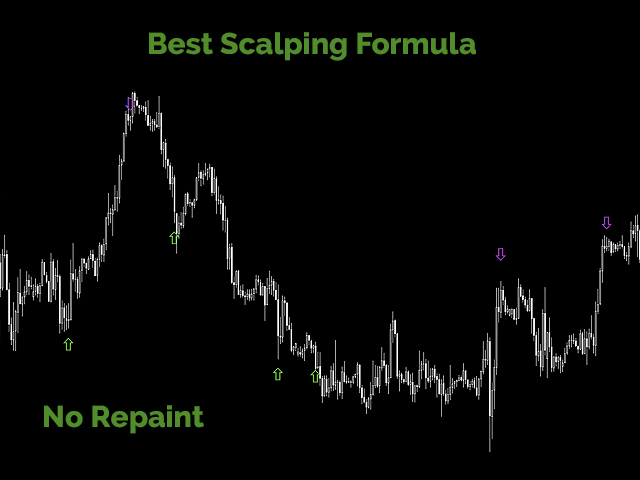
UR PulseScalp MT5 は、ペースの速い市場で究極の優位性を求めるスキャルパー向けの最先端の取引ソリューションです。 この革新的なインジケーターは、ボラティリティ、マネーフロー、相対強度の力を組み合わせて、非常に正確で信頼性の高いシグナルを作成する、科学的に調整された式に基づいて構築されています。

UR PulseScalp MT5 を使用する利点:

快適なインタラクティブパネル
M5 と H1 で高精度
初心者におすすめの EURUSD ペア
設定なし
あらゆる種類のアセットに調整
すべての波をキャッチするわけではありません - それがその美しさです。 それを待たなければならない場合でも、最良のエントリを分析します。
ツールの最新情報を入手できる特別な電報チャットがあり、何か不足していると感じた場合はリクエストを送信することもできます!


UR PulseScalp MT5 を選ぶ理由

あなたがベテランのスキャルパーであろうと初心者であろうと、「UR PulseScalp」は、金融市場の乱流をナビゲートするための理想的な仲間です.
UR PulseScalp MT5 は、長年の取引とその過程でのリスク管理のための最良のソリューションに基づいて作成されました。 視覚的にも快適で使いやすいです。 確かなデータと統計分析に裏打ちされた、情報に基づいた迅速な取引を行うことができます。 この精密に設計されたツールは、市場の状況をリアルタイムで把握できるため、迅速かつ断固として行動し、あらゆる機会をとらえることができます。

UR PulseScalp MT5の使い方は?

インジケーターを開始する
インジケーターの設定で何も設定する必要はありません - すべてがインタラクティブパネルで設定されています
信号の提供に応じて行動する - アップまたは
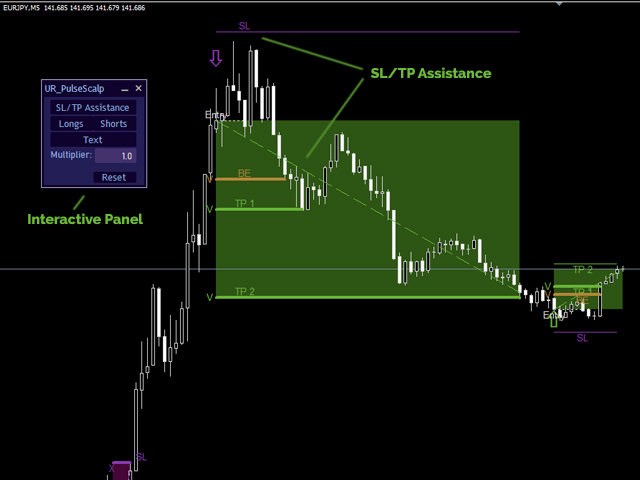
SL/TP アシスタンスを表示して、SL と TP レベルのセットアップを支援します - 必要に応じて
SL/TP アシスタンスをセットアップして、必要なものや取引の方向性を表示します


画面

両側矢印: 指定された方向に進入する瞬間を示します。
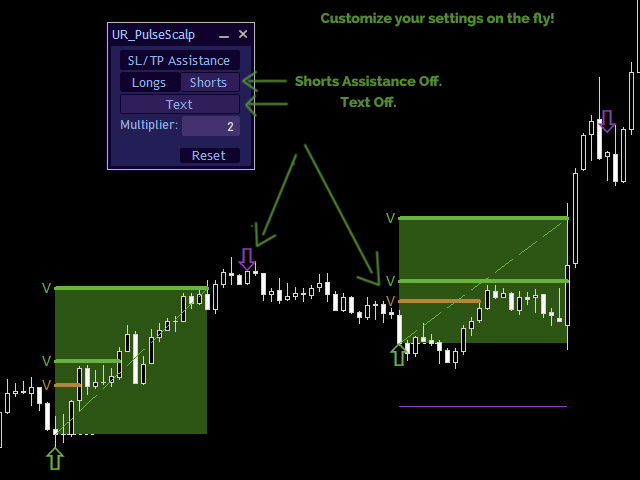
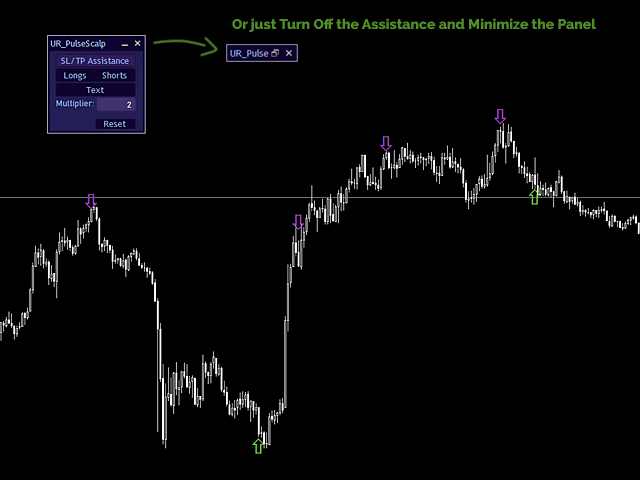
フローティング パネル: チャート インジケーターをセットアップするためのインタラクティブなパネル
SL/TP アシスタンス: 提案された SL および TP レベルのオン/オフを設定します
Longs/Shorts: Longs と Shorts のアシストのオン/オフを設定します。
テキスト: SL/TP アシスタンス周辺のテキストのオン/オフを設定します
乗数: アシストの乗数 - SL と TP のレベルに影響します
リセット: 視覚的に壊れた場合に備えてインジケーターを再初期化します
おすすめのプロダクト
Project IG MT5
Ruslan Pishun
1.57 (7)
The EA is not a scalper. The EA uses a strategy based on the breakdown of local support and resistance levels, also uses the reverse and rebound from support and resistance levels.  The EA is based on the original author's strategy. Real monitoring:   https://www.mql5.com/en/signals/author/profi_mql Detailed description of the strategy here:  https://www.mql5.com/ru/blogs/post/728430 This is a link for general discussion of the EA:  https://www.mql5.com/ru/blogs/post/728430 Hidden Take profit,
Trend indicator, a revolutionary unique solution for trend trading and filtering with all important trend features built into one tool! This is a 100% non-repainting multi-timeframe and multi-currency indicator that can be used on all currency pairs. HandleTrend is an effective trend following indicator that gives trend signals in the form of arrows on the chart.
TPO Profile MT5
Kyra Nickaline Watson-gordon
Definition : TPO is a Time Price Opportunity. Instead of using bars or candles with an Open, High, Low, and Close price, each "bar" in a Market Profile is represented by horizontal bars against the price It is called Market Profile terminology. In other words time-price-opportunity (TPO) profiles are histograms of how much time was spent at each price within the span of the profile. By using a TPO chart, you are able to analyze the amount of trading activity, based on time, for each price leve
It is very easy to use the Fibrillar indicator, since the simplest is to look at the chart and act according to the indications of the colored arrows. The algorithm takes into account the measurement of prices, and this method also focuses on measuring each of the price drops (H / C, H / O, LC, LO) - which gives more detailed information, but also more averaged. When calculating this indicator, logarithmic gains are first calculated at the closing price, which allows you to filter out the tre
[75% OFF - SALE ENDS SOON] - RevCan Trend Entry Point   is a trend based trade alert indicator for serious traders. It does all the price and chart analysis all by itself, and whenever it finds any potential high quality trading opportunity(Buy or Sell) using its revolutionized price prediction algorithms, it sends instant trade alert directly on the chart, MT4 terminal and on the mobile device.  The trade signals will be visible on the chart as Up and Down arrows, while the instant audible ale
This is my version of Currency Strength Meter.  One of the best indicators for spotting weak and strong currencies. Based on the information obtained, its very simple to decide which currency buy and which sell.  It is very simple to use, but extremely effective.  General rules are: - Buy currencies above level 0  - Sell currencies below level 0 You can also mix the main currencies together -->  EURUSD > 0 and USDJPY < 0  --> BUY on EURJPY 
FREE
ゴールドターゲットは最良のトレンド指標です。 このインジケーターの独自のアルゴリズムは、テクニカル分析と数学的分析の要素を考慮して資産価格の動きを分析し、最も収益性の高いエントリーポイントを決定し、矢印の形でシグナルと価格レベル(買いエントリー/売りエントリー)を発行します。 注文を開きます。 このインジケーターには、ストップロスの価格レベルとテイクプロフィットの 5 つの価格レベルもすぐに表示されます。 注意:   このインジケーターは非常に使いやすいです。 ワンクリックでチャートにインジケーターをインストールし、そのシグナルと価格レベルに基づいて取引します。 インジケーターの利点: 1. インジケーターは高精度の信号を生成します。 2. インジケーター信号は再描画されません。 価格が各ラインを超えた場合に音声通知(アラート&メッセージ)を搭載しています。 3. どのブローカーの MetaTrader 5 取引プラットフォームでも取引できます。 4. あらゆる資産(通貨、金属、暗号通貨、株、指数など)を取引できます。 5. 任意の時間枠で取引できます (M15-M30
Binary Options Assistant (BOA) BOIL Signals Indicator provides signals based on Ana Trader Binary Options Strategy. Indicators: Stochastic Stop missing trades, stop jumping from chart to chart looking for trade set-ups and get all the signals on 1 chart! U se any of the BOA Signals Indicator with the  Binary Options Assistant (BOA) Multi Currency Dashboard .  All BOA Signal Indicator settings are adjustable to give you more strategy combinations. The signals can be seen visually and heard au
Discover the ultimate trading companion—our exclusive robot tailored for GBPUSD and EURUSD pairs. Crafted through a synergy of diverse strategies, this innovative solution promises unparalleled results, making it the perfect starting point for your trading journey. Equipped with comprehensive account statistics, this robot offers real-time monitoring capabilities, empowering you to stay on top of your trades throughout the day. Customise lot sizes effortlessly to align with your trading goals an
ScalperMultiMT5 is a multicurrency indicator for professional traders. The indicator shows the complete market situation for the trader. The main advantage of this indicator is that it simultaneously analyzes six major currency pairs on all timeframes from M1 to MN. The indicator analyzes the trend strength. The indicator generates color-coded signals to visualize the market situation: Green - ascending trend. Red - descending trend. Yellow - trend is not defined. The indicator is excellent for
Expert. Automatic and manual trading. Ready-made trading system based on Elliott waves and Fibonacci retracement levels . It is simple and affordable. Display of the marking of Elliott waves (main or alternative option) on the chart. Construction of horizontal levels, support and resistance lines, a channel. Superposition of Fibonacci levels on waves 1, 3, 5, A Alert system (on-screen, E-Mail, Push notifications).    visual panel for opening orders in manual trading. visual panel for setting up
What is KTrend indicator ? KTrend is a powerful indicator for trading medium-term binary options that identify the trend of price by candlesticks. Sell signal is formed when the value is below the zero line. Similarly, buy signal is formed when the value is above the zero line. It is separated from KTrend trading system and you can get the backtest result from the pictures below.
My Trendline is an Indicator based on Upper and Lower Trendline which will Plot Automatically into the Chart. This Indicator will perfectly indicate you the Trend of the Market. It can be use in any Time Frame. The Indicator will automatically adjust according to the Current Time Frame. Steps to Setup the Indicator: Install the Custom Indicator; Set all the Inputs, Line Color, Width and Styles etc. (Can use the Default Setting also); Set visualization to All Timeframe; and DONE It ca
Hello There, Today I want to show you my new researchable fore BUY SELL indicator, it work all asset, and also work Derive Volatility asset! it work all time frame, but i recommend start 5 minute to H1 when you receive a signal just take trade and stay wait for your take profit asset All Major Pair And minor IT WORK ALSO XAUUSD Fantastic results,  for more info,,, message us thank you   
Volatility Trend System - a trading system that gives signals for entries. The volatility system gives linear and point signals in the direction of the trend, as well as signals to exit it, without redrawing and delays. The trend indicator monitors the direction of the medium-term trend, shows the direction and its change. The signal indicator is based on changes in volatility and shows market entries. The indicator is equipped with several types of alerts. Can be applied to various trading in
Dragon Bolling
Ignacio Agustin Mene Franco
Dragon Bolling. is an indicator programmed as enhanced bollinger bands It has an up, medium and down, to grab long cut and short, special for scalping works in all seasons in the forex markets and synthetic indices, in forex all the pairs in synthetic indices all pairs, but also designed to operate volatility and jumps! in m1 . m5 and m15, scalping to sign in h1 and h4 for lengths!
トレンドキャッチャー: アラートインジケーター付きのトレンドキャッチャーストラテジーは、市場トレンドやポテンシャルなエントリーポイントやエグジットポイントを特定するのに役立つ多目的な技術分析ツールです。動的なトレンドキャッチャーストラテジーを備えており、市場状況に適応してトレンドの方向を明確に視覚化します。トレーダーは、自身の好みやリスク許容度に合わせてパラメーターをカスタマイズできます。このインジケーターはトレンドの識別を支援し、ポテンシャルなリバーサルをシグナルし、トレイリングストップのメカニズムとして機能し、市場への迅速な対応のためのリアルタイムアラートを提供します。 特徴: - トレンドの識別:上昇トレンドと下降トレンドをシグナルします。 - トレンドのリバーサル:ローソク足の色が上昇から下降に変わった場合やその逆の場合に、ポテンシャルなリバーサルを警告します。 - リアルタイムアラート:新しいトレンドの識別に対するアラートを生成します。 推奨事項: - 通貨ペア:EURUSD、AUDUSD、XAUUSDなど... - タイムフレーム:H1。 - アカウン
FREE
The implementation of the Trend Turn trend indicator is simple - in the form of lines of two colors. The indicator algorithm is based on standard indicators as well as its own mathematical calculations. The indicator will help users determine the direction of the trend. It will also become an indispensable advisor for entering the market or closing a position. This indicator is recommended for everyone, both beginners and professionals. How to interpret information from the indicator. We se
The Bollinger R (Bollinger Reversals) is designed to recognize short term high profitable counter trend patterns from the chart. This system combines both Bollinger Bands and mean reversion to define positions where the market could potentially reverse direction. This is the MT5 version of Bollinger R Description Bollinger Bands are well known in the trading community. I have added the concepts mean reversion and "distance between Price and a Moving Average" to help confirm and trade the “bounce
This indicator is based on the crossing of two Moving Average with the RSI It is intended for scalpers Specially designed for Boom and Crash syhtetic indices from Binary.com/Deriv.com It is easy to use and intuitive. We recommend its use on M1 and is equipped with three types of notification Email alert Sound notification Push notification these parameters can be activated and deactivated.
A powerful oscillator that provide Buy and Sell signals by calculating the investor liquidity. The more liquidity the more buy possibilities. The less liquidity the more sell possibilities. Please download the demo and run a backtest! HOW IT WORKS: The oscillator will put buy and sell arrow on the chart in runtime only . Top value is 95 to 100 -> Investors are ready to buy and you should follow. Bottom value is 5 to 0 -> Investors are ready to sell and you should follow. Alert + sound will app
Perfect Sniper
Ignacio Agustin Mene Franco
Perfect Sniper! is a triple indicator with support resistance detection, downtrend channel, uptrend channel Bands included! where he hunts the rebounds in the red lines for sale, in the green lines mark purchase, in the lower bands that are the breaks gives another second entry either buy or sell, perfect to take advantage of the double entrance, It is used in any temporality, It is used to scalp and long on h1 or h4 to D1. It works for Forex markets, All pairs. It is used for the synthetic inde
Candle EA MT5
Mansour Babasafary
4.33 (42)
This expert is based on patterns The main patterns of this specialist are candlestick patterns Detects trends with candlestick patterns It has a profit limit and a loss limit, so it has a low risk The best time frame to use this expert is M30 time frame The best currency pairs to use with this expert is the EURUSD, GBPUSD, AUDUSD, USDCAD currency pairs The price will increase by 100$ after every 10 purchases! Final price 2450$ Get a 50% bonus by buying (or even renting) any of our product
General Description In the simplest terms this is a contrarian intra-day scalping system. Built to try and let correct trades run as far as possible and flip the trade when indicated. Join the conversation over at our Discord channel  -  https://discord.gg/ScsdkTnwyA I will do my best to be around to answer any questions and help set up. If you want to add your settings screenshots its more than welcome! The EA looks at historical daily trading ranges to lay out levels at which it takes long
The Antique Trend Indicator is a revolutionary trend trading and filtering solution with all the important features of a trend tool built into one tool! The Antique Trend indicator is good for any trader, suitable for any trader both for Forex and binary options. There is no need to configure anything, everything has been perfected by time and experience, it works great during flats and trends. The Antique Trend indicator is a tool for technical analysis of financial markets, reflecting curre
In MetaTrader, plotting multiple   horizontal lines   and then tracking their respective price levels can be a hassle. This indicator automatically plots multiple horizontal lines at equal intervals for setting price alerts, plotting support and resistance levels, and other manual purposes. This indicator is suitable for Forex traders who are new and looking for chances to make quick profits from buying and selling. Horizontal lines can help traders find possible areas to start trading when the
Supply and Demand Monster
Tsog Erdene Borjigon Enkhkhudulmur
Supply and demand zones are at the heart of   supply and demand trading . These zones are areas that show  liquidity at a specific price.  The supply zone is also called the distribution zone, while the demand zone is called the accumulation zone.   Our indicator automatically draw supply and demand zones in Metatrader 5. It give opportunity to understand trading zone and avoiding risk.
General Description In the simplest terms this is a contrarian intra-day scalping system. Built to try and let correct trades run as far as possible and flip the trade when indicated. The indicator looks at historical daily trading ranges to lay out levels at which it takes long and short positions based on the statistical levels. The indicator is built around index futures, mainly around S&P and the DOW but can be used an any futures contract mainly using AMP Futures to trade. The indicator is
Holeshot MAX
Carter Kyle Capital Inc.
Holeshot Max – Your Ultimate Trading Companion Holeshot Max is not just another trading tool; it's a sophisticated ally designed to empower traders of all levels to conquer the markets with ease. Built on the powerful Metatrader 5 platform, Holeshot Max is equipped with a custom equity management system that puts the control firmly in your hands. Say goodbye to stress and uncertainty – with Holeshot Max, you can trade worry-free, knowing that your risk tolerance and behavior are fully customizab
Holeshot Max MT5
Carter Kyle Capital Inc.
Holeshot Max – Your Ultimate Trading Companion Holeshot Max is not just another trading tool; it's a sophisticated ally designed to empower traders of all levels to conquer the markets with ease. Built on the powerful Metatrader 5 platform, Holeshot Max is equipped with a custom equity management system that puts the control firmly in your hands. Say goodbye to stress and uncertainty – with Holeshot Max, you can trade worry-free, knowing that your risk tolerance and behavior are fully customizab
このプロダクトを購入した人は以下も購入しています
まず第一に、この取引インジケーターは再描画されず、再描画されず、遅延しないことを強調する価値があります。これにより、手動取引とロボット取引の両方に理想的なものになります。 ユーザーマニュアル:設定、入力、戦略。 アトミックアナリストは、価格の強さとモメンタムを利用して市場でより良いエッジを見つけるためのPA価格アクションインジケーターです。ノイズや誤ったシグナルを除去し、取引ポテンシャルを高めるための高度なフィルターを備えています。複雑なインジケーターの複数のレイヤーを使用して、アトミックアナリストはチャートをスキャンし、複雑な数学的計算をシンプルなシグナルと色に変換します。これにより、どのような初心者トレーダーでも理解して使用し、一貫した取引の決定を行うことができます。 「アトミックアナリスト」は、新規および経験豊富なトレーダー向けにカスタマイズされた包括的な取引ソリューションです。プレミアムインジケーターとトップノッチの機能を1つの取引戦略に組み合わせ、すべてのタイプのトレーダーにとって汎用性のある選択肢にします。 デイリートレーディングとスキャルピング戦略:高速で正確な
Reversal First Impulse levels (RFI)      INSTRUCTIONS        RUS       -       ENG              R ecommended to use with an indicator   -   TREND PRO -  Version MT4                 A key element in trading is zones or levels from which decisions to buy or sell a trading instrument are made. Despite attempts by major players to conceal their presence in the market, they inevitably leave traces. Our task was to learn how to identify these traces and interpret them correctly. Main functions:: Di
74% discount for the next 10 buyers (original price $605): 1 left Get a 50% bonus by buying (or even renting) any of our products. After buying (or renting), send a message for more information. 3 Indicators in 1 indicator Strategy based on price action Made specifically for the best forex currency pairs Can be used in the best time frame of the market at a very reasonable price This indicator is basically 3 different indicatos . But we have combined these 3 indicators in 1 indicator so th
Bill Williams Advanced is designed for automatic chart analysis using Bill Williams' "Profitunity" system. The indicator analyzes four timeframes at once. Manual (Be sure to read before purchasing) Advantages 1. Automatically analyzes the chart using the "Profitunity" system of Bill Williams. The found signals are placed in a table in the corner of the screen. 2. Equipped with a trend filter based on the Alligator indicator. Most of the system signals are recommended to be used only accordi
FX Volume MT5
Daniel Stein
4.94 (17)
mql5と Telegramの モーニング・ブリーフィングで、詳細とスクリーンショットを含む毎日のマーケット・アップデートをご覧 ください! FX Volumeは、ブローカーの視点から市場のセンチメントをリアルに洞察する、最初で唯一の出来高インジケーターです。 ブローカーのような機関投資家が外国為替市場でどのようなポジションをとっているか、COTレポートよりもはるかに速く、素晴らしい洞察を提供します。 この情報をチャート上で直接見ることは、あなたの取引にとって真のゲームチェンジャーであり、画期的なソリューションです。 以下のようなユニークなマーケットデータ洞察から利益を得てください。 比率は 、通貨のロングポジションとショートポジションの比率をパーセントで表示します。 比率の変化は 、選択した期間内のロング比率とその変化率を表示します。 Volumes Totalは 、通貨の取引量(ロングとショート)の合計をロット単位で表示します。 Volumes Long :全通貨のロングポジションの取引量を表示します。 Volumes(ショート )は、全通貨のショートポジションの取引量を表示
現在33%オフ 初心者にもエキスパートトレーダーにも最適なソリューション このインジケーターは独自の機能と新しい公式を多数内蔵しており、ユニークで高品質かつ手頃な取引ツールです。このアップデートでは、2つの時間枠ゾーンを表示できるようになります。より長いTFだけでなく、チャートTFとより長いTF(ネストゾーンを表示)の両方を表示できます。すべてのSupply Demandトレーダーの皆さんのお気に召すはずです。:) 重要情報の公開 Advanced Supply Demandの可能性を最大化するには、 https://www.mql5.com/ja/blogs/post/720245 にアクセスしてください。   エントリーまたはターゲットの正確なトリガーポイントを正確に特定できれば取引がどのように改善されるか想像してみてください。新しい基盤となるアルゴリズムに基づいて構築されているため、買い手と売り手の間の潜在的な不均衡をさらに簡単に特定できます。これは、最も強い需要と供給のゾーンと、過去のパフォーマンス(古いゾーンを表示)がグラフィカルに表現されるためです。これらの機能は、最適
WHY IS OUR FXACCCURATE LS MT5 THE PROFITABLE ? PROTECT YOUR CAPITAL WITH RISK MANAGEMENT Gives entry, stop and target levels from time to time. It finds Trading opportunities by analyzing what the price is doing during established trends. POWERFUL INDICATOR FOR A RELIABLE STRATEGIES We have made these indicators with a lot of years of hard work. It is made at a very advanced level. Established trends provide dozens of trading opportunities, but most trend indicators completely ignore them!
クリスマスセール!40% OFF!1月1日に価格が$250に値上がり! GoldenGate Entriesをご紹介します:最先端のトレーディングソリューション! GoldenGate Entries(GGE)を使用して取引する革新的なアプローチを発見しましょう。GGEは、取引体験を向上させるために設計された先進的なインジケーターで、ユーザーに正確性と自信を持たせるための包括的な機能を提供します。 通貨ペア:Any(FX - 商品 - 株式 - 株式 - クリプト) タイムフレーム:15分からH1 主な特徴: 買いと売りの矢印の指示:常に情報を受け取るために、買いと売りの矢印の指示をポップアップアラートとともに受け取ります。 GoldenGate_Algo:GoldenGate_Algoを使用して市場の状況を把握し、市場が「売り過ぎ」または「買い過ぎ」かどうかを評価する強力なツールです。 現在のトレンド分析:視聴中のタイムフレームで現在のトレンドにアクセスして、取引を市場の主流方向に合わせることができます。 組み込みのピボットポイント:組み込まれた
Professional Scalping Tool on Deriv Attention! The indicator will be sold in limited quantities!!! The previous 5 copies were sold for $250 The remaining 4 copies will be sold for $350 The next price is $500 Description: This trading indicator is designed for professional traders focused on scalping. Designed with the market in mind, it provides highly accurate spike trading signals. It works on the M1 timeframe and supports the following symbols: Boom 300 Index, Boom 500 Index, Boom 1000 I
MetaForecast M5
Vahidreza Heidar Gholami
5 (2)
MetaForecastは、価格データのハーモニクスに基づいて、どんな市場の未来を予測し視覚化します。市場が常に予測可能ではありませんが、価格にパターンがある場合、MetaForecastは可能な限り正確な未来を予測できます。他の類似製品と比較して、MetaForecastは市場のトレンドを分析することでより正確な結果を生成することができます。 入力パラメータ Past size (過去のサイズ) MetaForecastが将来の予測を生成するために使用するバーの数を指定します。モデルは選択したバー上に描かれた黄色の線で表されます。 Future size (将来のサイズ) 予測すべき将来のバーの数を指定します。予測された将来は、ピンクの線で表示され、その上に青い回帰線が描かれます。 Degree (程度) この入力は、MetaForecastが市場で行う分析のレベルを決定します。 Degree 説明  0 Degree 0の場合、価格の全てのピークや谷、そして詳細をカバーするために、「Past size」の入力に大きな値を使用することが推奨されています。  1 (推奨) Degr
The Volume by Price Indicator for MetaTrader 5 features Volume Profile and Market Profile TPO (Time Price Opportunity). Volume and TPO histogram bar and line charts. Volume Footprint charts. TPO letter and block marker collapsed and split structure charts. Session filtering and grouping. Static, dynamic and flexible range segmentation and compositing methods with relative and absolute visualizations. Graphical layering, positioning and styling options to suit the user's analytic and aesthetic n
Introducing the South African Sniper indicator created by a small group of traders with a few years trading trading the financial market profitably . This is a plug and play indicator that provides you with  BUY and SELL (SNIPER ENTRY) signals with TARGET and trail stops. The indicator Works with all MT5 trading instruments. The indicator uses previous  chart data as receipt to speculate on future market moves.
これはほぼ間違いなく、MetaTraderプラットフォームで見つけることができる最も完全な調和価格形成自動認識インジケーターです。 19種類のパターンを検出し、フィボナッチプロジェクションをあなたと同じように真剣に受け止め、潜在的逆転ゾーン(PRZ)を表示し、適切なストップロスとテイクプロフィットレベルを見つけます。 [ インストールガイド | 更新ガイド | トラブルシューティング | よくある質問 | すべての製品 ] 19の異なる調和価格形成を検出します プライマリ、派生および補完フィボナッチ投影(PRZ)をプロットします 過去の価格行動を評価し、過去のすべてのパターンを表示します この指標は、独自の品質とパフォーマンスを分析します 適切なストップロスとテイクプロフィットのレベルを表示します ブレイクアウトを使用して適切な取引を通知します すべてのパターン比をグラフにプロットします 電子メール/音声/視覚アラートを実装します スコット・M・カーニーの本に着想を得て、この指標は最も純粋で急を要するトレーダーのニーズを満たすように設計されています。ただし、トレードを
Step into the realm of Forex trading with confidence and precision using XQ, a cutting-edge Forex indicator designed to elevate your trading game to unprecedented heights. Whether you're a seasoned trader or just stepping into the world of currency exchange, XQ Forex Indicator empowers you with the insights and signals needed to make informed trading decisions. The signal conditions are a combination of three indicators, and XQ Forex Indicator only display  medium and long-term trends . The ind
Noize Absorption Index - is the manual trading system that measures the difference of pressure between bears forces and bulls forces. Green line - is a noize free index that showing curent situation. Zero value of index shows totally choppy/flat market.Values above zero level shows how powerfull bullish wave is and values below zero measures bearish forces.Up arrow appears on bearish market when it's ready to reverse, dn arrow appears on weak bullish market, as a result of reverse expectation.
note: this indicator is for METATRADER4, if you want the version for METATRADER5 this is the link:  https://www.mql5.com/it/market/product/108106 TRENDMAESTRO ver 2.4 TRENDMAESTRO recognizes a new TREND in the bud, he never makes mistakes. The certainty of identifying a new TREND is priceless. DESCRIPTION TRENDMAESTRO identifies a new TREND in the bud, this indicator examines the volatility, volumes and momentum to identify the moment in which there is an explosion of one or more of these data a
"Piranha" - an autonomous trading system that determines overbought and oversold levels on the chart. Red and blue zones represent overbought and oversold levels respectively. Entry points are marked with arrows: a downward arrow in the red zone for "sell" and an upward arrow in the blue zone for "buy". The Take profit level is indicated by the green moving average. Key features: Adjusting the Take profit level as the green moving average changes position. Averaging ability when a new market e
TREND HARMONY MT5 – Multi Timeframe Trend and Phase and Pullback Level Visualizer indicator for Metatrader5 The TREND HARMONY indicator automates deep trend analysis and generates visualizations for you. Take control of your trades by eliminating uncertainty! Revolutionize your trading experience with precision and insight through the TREND HARMONY Multi Timeframe indicator – your ultimate MT5 trend visualization indicator. [  Features and Manual   | MT4 version |   All Products   ] Are you t
Good day! I present to you a trading technical indicator for Deriv broker synthetic indices. This indicator ONLY works with the following indices: Boom 300 Index Boom 500 Index Boom 1000 Index Crash 300 Index Crash 500 Index Crash 1000 Index The indicator was created to give signals to open medium-term trades in the direction of Spikes. But you can open trades in the opposite direction to Spikes, at your own risk. Trade only on M1. Other TFs do not guarantee the correct operation of the indic
ENG-GOLD Scalper It is an auxiliary indicator that identifies potential targets and determines the place of entry with a stop loss that works on Heiken Ashi candles  The green lines are usually the targets, the red lines are the stop loss, and the yellow lines are the entry location.  This file is recognized on small and medium frames, usually less than the watch frame I highly recommend using XAUUSD US100 US30 USOIL 
TPA True Price Action indicator reveals the true price action of the market makers through 100% non-repainting signals strictly at the close of a candle! TPA shows entries and re-entries, every time the bulls are definitely stronger than the bears and vice versa. Not to confuse with red/green candles. The shift of power gets confirmed at the earliest stage and is ONE exit strategy of several. There are available now two free parts of the TPA User Guide for our customers. The first "The Basics"
Do you believe that financial markets and celestial bodies operate in separate realms? Our indicator begs to differ! Based on the innovative theory of William Gann, which emphasizes the influence of celestial planet movements on financial market dynamics, we present to you the "Gann Planetary Lines Indicator". Features of the Indicator : Precision : Accurate projection of the 360 degrees of planetary orbits onto price charts. Advanced Customization : Ability to display or hide any planet line,
IVISTscalp5
Vadym Zhukovskyi
5 (3)
iVISTscalp5インジケーターをご紹介します。このインジケーターは、トレーディングにおいて独自でありながら効果的です。時間データに基づくこのインジケーターは、多年にわたる経験と金融市場の深い分析の結果です。iVISTscalp5インジケーターは、手動トレーディングにとって優れたツールです。便利さ、簡単さ、可視化 - すべての複雑さが内部に隠されています。私たちは、iVISTscalp5インジケーターの設定と使用を最大限に簡素化しました。このインジケーターは、MT5ターミナルにあるすべての金融商品に適しています。 稼働時間は、4時から20時(UTC+3)です。 iVISTscalp5インジケーターメニュー(スクリーンショット1を参照): History - 引用を計算する週数 dT_min - 時間間隔の選択(分) TFline - 水平ボリュームの作成(時間枠) BARSline - 水平ボリュームの作成(バー数) TFtrend1 - デイリーチャンネルの作成(時間枠) BARStrend1 - デイリーチャンネルの作成(バー数) TFtrend2 - 週次チャンネルの作成(時
Golden Spikes Detector This indicator is based on an advanced strategy primarily for trading spikes on Boom and Crash Indices. Complex algorithms were implemented to detect high probability entries only. It alerts on potential Buy and Sell entries. To trade spikes on the Deriv or Binary broker, only take Buy Boom and Sell Cash alerts. It was optimised to be loaded on 5-minute timeframe although multiple timeframe analysis is done in the background. Features ·             Desktop pop up and sound
Тем, кто изучил книги Билла Вильямса "Новые измерения в биржевой торговле" и "Торговый Хаос (второе издание)" и пробовал торговать по этим методикам, становится ясно, что стандартного набора индикаторов недостаточно для полноценной работы. Индикатор  Trading Chaos Map  рисует "карту рынка", позволяя вам видеть графики так же, как автор трилогии. В параметрах предусмотрены опции включения и отключения каждого сигнала. Вы можете использовать ту или иную методику, либо использовать их вместе. Может
Tape Reading, flow monitoring. FabFlowInPrice   is a powerful indicator for those who like Tape Reading (Times & Trades). It presents the volumes traded at each price level, considering the purchase, sale and direct aggressions for each level. Excellent tool for market flow analysis. Thought of flow so monitor who is attacking the most, buyers, sellers or direct exchanges, thought FabFlowInPrice. The indicator displays information in 4 distinct and fixed periods, on any timeframe: @Day - All
スイングトレーディング は、トレンドの方向のスイングと可能な反転スイングを検出するように設計された最初のインジケーターです。トレーディングの文献で広く説明されているベースラインスイングトレーディングアプローチを使用します。インディケータは、いくつかの価格と時間のベクトルを調査して、全体的なトレンドの方向を追跡し、市場が売られ過ぎまたは買われ過ぎて修正の準備ができている状況を検出します。 [ インストールガイド | 更新ガイド | トラブルシューティング | よくある質問 | すべての製品 ] むち打ちを起こさずに市場スイングの利益 インジケーターは常にトレンドの方向を表示します 色付きの価格帯は機会のベースラインを表します 色付きのダッシュは、可能な反転スイングを表します この指標は、独自の品質とパフォーマンスを分析します 複数時間枠のダッシュボードを実装します カスタマイズ可能なトレンドおよびスイング期間 電子メール/サウンド/プッシュアラートを実装します インジケータは再描画またはバックペインティングではありません Swing Tradingとは Swing Tradi
NakaSide
Ricardo De Andrade Nakano
NakaSideをご紹介します - あなたの究極の市場機会指標! 利益の出る取引の機会を見逃すことにうんざりしていますか?取引を次のレベルに引き上げる準備はできていますか?もう探す必要はありません。NakaSideが登場し、取引方法を革命へと導きます! NakaSideは単なる一般的な指標ではありません。複雑な金融市場を自信を持ってかつ正確に航海するための秘密兵器です。高度なアルゴリズムと先進的なテクノロジーを駆使して、NakaSideは上昇トレンドと下降トレンドの両方でトレンドの変化を検出し、利益の出る機会を見つけるように設計されています。 NakaSideが上昇トレンドの変化を検出すると、鮮やかな緑色のドル記号が表示され、購入の機会があることを示します。逆に、トレンドが反転すると、目立つ赤いドル記号が表示され、売却の機会があることを示します。 しかし、ここでNakaSideが本当に際立つのは、トレンドの特定に留まらないところです。他の人が苦労する横ばい市場では、NakaSideが光を放ち、チャート全体に複数のドル記号を散りばめ、多数の潜在的なエントリーポイントを示
Gannスクエアインジケーターは、W.D. Gannによって執筆された「市場予測のための数学的な式」の記事に基づく強力な市場分析ツールです。このツールは、解析に数学的な概念を応用し、Gann理論に基づいています。それは、144、90、52のスクエアや9のスクエアなど、Gannの関連テクニックの要素を取り入れています。さらに、の方法を組み込んでおり、9のスクエアとその関連性についてのチャネルやスターパターンに焦点を当てています。 ユーザーマニュアルと使用方法: このインジケーターを使用する前に、ユーザーマニュアルを読んで疑問点を解決するためにお問い合わせいただくことをお勧めします。ユーザーマニュアルの完全版は、当社のウェブサイトで入手できます。 MT5の完全版は購入できますし、MT4の無料版も試すことができます。両方のバージョンへのリンクを提供していますので、ご利用ください。 主な機能と機能: Gannスクエアインジケーターは、市場分析のための完全なツールセットを提供し、幾何学的な概念とGann理論に基づいて的確な判断を行う手助けをします。以下に主な機能を示します。 9のスクエアの分析:
RAD CRITICAL LEVES RAD indicator tracks “Relevant Volume” in real time, identifying accumulation and distribution processes, projecting them in the chart as SUPPORT or RESISTANCE zones. Natural   support   and resistance levels are generated by Volume Accumulation and Distribution processes. As these processes evolve, levels at which the relevant volume in the market place is positioned, become difficult areas to cross upwards or downwards. By using this information, traders can identify very s
作者のその他のプロダクト
URバスケット   あなたができる最善のことは、注文が損失にならないようにすることです。 あとはUR Basketにお任せください。 UR バスケットを使用する利点: すべてのパラメータは、チャートのグラフィック パネルで動的に変更可能です - パラメータを変更したり、使用した設定を思い出したりするために EA を再起動する必要はありません! 次の方法で注文を追跡できます。   - マジックナンバー   - EAコメント   - 上記の両方   - 一度にすべての取引 UR Basket は、CURRENCY 値、PIPS、または BALANCE または EQUITY の % を通じて利益を追跡できます。 グラフィック パネルは、これら 3 つの方法での利益を常に表示し、彼に指示する頻度を更新します。 最大の利点: 利益を確保できるため、損失を被ることはありません! 詳細については、以下をご覧ください。 ツールの最新情報を入手できる特別な電報チャットがあり、何か不足していると感じた場合はリクエストを送信することもできます! なぜURバスケット? 単独で取引でき
MetaTrader 5用 UR_TradeManager MetaTrader 5プラットフォーム専用に設計された究極のトレーディング強化ツールであるUR_TradeManagerを使用して、トレーディングポテンシャルを最大限に発揮しましょう。精密さと機能性を念頭に置いて作られたこの包括的なツールは、市場分析、実行、管理スキルを向上させたいトレーダーにとって不可欠です。 主な特徴: ビジュアルトレーディングダッシュボード : MetaTrader 4のワークスペースに統合された洗練されたダッシュボードから直接トレードを管理します。前例のない容易さと正確さで取引を実行、修正、終了させることができます。 リアルタイムニュース統合 : リアルタイムの更新情報で常に先を行きます。当ツールは、最新の市場データに基づいた情報に基づいて意思決定を行うことができるよう、重要な財務ニュースを直接トレーディング環境に引き込みます。 高度なアラートシステム : 価格レベル、市場イベント、またはインジケーターの結果に対するカスタムアラートを設定し、取引の機会や潜在的なリスクを決して見逃さないようにし、24時
UR Control Panel
Krzysztof Jan Debski
5 (2)
URコントロールパネル   UR コントロール パネルは、無料で共有したいツールです。 これはインタラクティブなパネルであり、私の取引を助け、毎日の市場スキャンを後押ししてくれました。 それがあなたのニーズにも合うことを願っています! UR コントロール パネルの使い方 これは、移動可能でサイズ変更可能なダブル パネルです。 - それらの1つは、指定された時間枠での通貨の強さを示しています - もう1つは、同じチャートを使用して、シンボルと時間枠の間をより速く移動するオプションを有効にし、価格が移動する特定のチャネル内のレジスタンス/サポートレベルをさらに表示します 設定 シンボル: 通常使用するすべてのシンボルを有効にします チャネル トレンドラインを無限大に: チャネルの方向を拡大します。 ブローカー サイン: ブローカーがシンボルに使用する特殊文字を追加します *ある場合* 期間: 通貨強度メーターが特定の通貨強度を計算する時間枠を設定します。
FREE
UR Basket
Krzysztof Jan Debski
URバスケット   あなたができる最善のことは、注文が損失にならないようにすることです。 あとはUR Basketにお任せください。 UR バスケットを使用する利点: すべてのパラメータは、チャートのグラフィック パネルで動的に変更可能です - パラメータを変更したり、使用した設定を思い出したりするために EA を再起動する必要はありません! 次の方法で注文を追跡できます。   - マジックナンバー   - EAコメント   - 上記の両方   - 一度にすべての取引 UR Basket は、CURRENCY 値、PIPS、または BALANCE または EQUITY の % を通じて利益を追跡できます。 グラフィック パネルは、これら 3 つの方法での利益を常に表示し、彼に指示する頻度を更新します。 最大の利点: 利益を確保できるため、損失を被ることはありません! 詳細については、以下をご覧ください。 ツールの最新情報を入手できる特別な電報チャットがあり、何か不足していると感じた場合はリクエストを送信することもできます! なぜURバスケット? 単独で取引でき
UR ダイバージェンススポッター   UR DivergenceSpotter は、長年の経験の結果であり、時には最も簡単な方法が最善です。 いくつかの指標の間には良好な相関関係がありますが、それらが一致しない場合 (価格は「再調整」しようとします)、UR DivergenceSpotter でシグナルを受け取るのはその瞬間です。 UR Divergence Spotter を使用する利点: パラメータなし ろうそくの作成後に再描画しません シグナルが有効でなくなった場合のシグナル (つまり、トレードをより長く保持し、ストップ ロスを BE に設定して乗り、部分的な利益を得るか、完全に閉じることができます!)。 この指標は、長年の経験と観察の結果です。 それはしっかりしていて、テスト済みです。 より良い結果とより安全な信号を得るには、より高い時間枠 (h1/h4) で使用するのが最適です。 加えて、UR TrendExhaustion や UR VolumeTrend などの私の他のインジケーターと一緒に使用して、シグナルの精度を高めることもできます。 ツールの最新情
UR ボリュームトレンド   UR VolumeTrend は、出来高の継続的な傾向を示す最も明確な出来高インジケーターです。 UR TrendExhaustion などの他のインジケーターと完全に連携して、ローカルのトップとボトムを示します。 パラメータは 2 つだけに制限されています。値が高いほど、トレンドが長く表示されます。 極端な勾配は、潜在的な反転を捉えるためにボリュームが枯渇する可能性を示しています。 2 本の線 - 出来高の傾向と平均です。 最大の利点: 簡単で、すべてのアセットに合わせて調整できます。 ツールの最新情報を入手できる特別な電報チャットがあり、何か不足していると感じた場合はリクエストを送信することもできます! UR VolumeTrend を選ぶ理由 トレンドを捉えるには出来高が鍵となることは誰もが認めるところです。 このオシレーターは、1 つの使いやすいインジケーターに圧縮されたすべてのボリューム ツールの合計です。 見やすい方法で正/負のボリュームを示します。 背後にあるインターフェイスは、ボリュームが過去に比べて使い果たされている
URトレンド枯渇   UR TrendExhaustion は、パラメータ値やその他の設定を扱いたくないトレーダーにとって最適なソリューションです。誰にとっても簡単で視覚的に理解できるものです。 UR TrendExhaustion を使用する利点: パラメータなし チャートで何が起こっているかを最もよく表す 3 つの線があります: トレンド枯渇線、クジラ マネー ライン、リテール マネー ラインです。 インターフェイスは、両極端 (赤い領域) のいずれかのラインの枯渇を示しています。 最大の利点: 簡単で、すべてのアセットに合わせて調整できます。 ツールの最新情報を入手できる特別な電報チャットがあり、何か不足していると感じた場合はリクエストを送信することもできます! なぜ UR TrendExhaustion なのか? 私はキャリアを通じて多くの種類のインジケーターをコーディングしてきましたが、チャート上の他のツールを必要とせずに取引するためのこのシンプルでありながら最高の (imo) ツールをコーディングするためにすべての知識を集めました。 分かりやすく、
URの高値と安値   UR Highs&Lows は、価格の動きとそのボラティリティを詳細に分析し、価格が変動するチャネルを作成します。 そのチャネルは現在、オシレーターとして動き、価格の偏差と重ね合わされて、潜在的な枯渇と反転の可能性を示しています。 UR Highs&Lows を使用する利点: パラメータなし 価格の動きを表す 3 本の線があります - 価格の平均である白線と、その極値である青線です。 ヒストグラムは、価格のコンテキストにおける最大偏差の視覚化です インターフェースは、両極端 (上部の赤と下部の青の領域) のいずれかの線の枯渇を示しています。 最大の利点: 簡単で、すべてのアセットに合わせて調整できます。 ツールの最新情報を入手できる特別な電報チャットがあり、何か不足していると感じた場合はリクエストを送信することもできます! なぜ UR の高値と安値なのか? このインジケーターは、スタンドアロンのエントリーまたはエグジット インジケーターとして使用できます。 価格に依存しているため、すべてのチャートに適用でき、偏差計算アルゴリズムは数年の経
UR モメンター   UR Moenter は、オシレータとして表される価格変動の枯渇に相関する価格のモメンタムを完全に計算します。 したがって、これは潜在的な反転またはリトレースメントの本当に初期のシグナルを提供します. この公式は、2018 年に市場バブルが崩壊した後に発見されました。 UR Moenter を使用する利点: パラメータなし 価格の動きを表す 2 本の線があります。白線は、オシレーター (青い線) として表される価格の移動平均偏差と相関する価格のモメンタムです。 ヒストグラムは、価格の勢いに応じた最大偏差を視覚化したものです インターフェースは、両極端 (上部の赤と下部の緑の領域) のいずれかの線の枯渇を示しています。 最大の利点: 簡単で、すべてのアセットに合わせて調整できます。 ツールの最新情報を入手できる特別な電報チャットがあり、何か不足していると感じた場合はリクエストを送信することもできます! UR モメンターを選ぶ理由 このインジケーターは、スタンドアロンのエントリーまたはエグジット インジケーターとして使用できます。 価格に依存
UR フロントエンドバックエンド   UR FrontEndBackEnd は、サポートとレジスタンスの最も正確なレベルを見つけるための私のお気に入りの公式です。 また、それらをさまざまなカテゴリ (破線、実線、および領域) に分割して、その強度を示しています。 すべてがバッファに格納されるため、簡単にアクセスして他のツール内で実装できます。 追加: ツールは、適用される資産に合わせて調整する必要がある場合があります。資産は、ツールに影響する価格の桁数に関して異なります。 そのために必要なパラメーターは、設定で提供されます。 UR FrontEndBackEnd を使用する利点: 計算の密度と距離を設定するための 2 つのパラメーターのみ サポートとレジスタンスはバッファ内に保存され、指定された資産の価格から上昇/下降します サポート/レジスタンスラインの強さをすばやく視覚的にフィードバックするための 3 種類のライン -> DASHED、SOLID、AREA ツールの最新情報を入手できる特別な電報チャットがあり、何か不足していると感じた場合はリクエストを送信
UR Gamma
Krzysztof Jan Debski
URガンマ (機械学習システムで見られる同様の計算を利用) UR Gamma は、従来の WaveTrend インジケーターを新しく改善したものを提供する最先端の財務分析ツールです。 高度なデジタル信号処理技術を組み込むことにより、UR Gamma は、従来の WaveTrend アルゴリズムの制限の一部に対処し、価格行動の傾向を特定および測定するためのより正確で堅牢で動的なアプローチを提供します。 UR ガンマを使用する利点: ミニマルなセットアップ すべてのデータはバックグラウンドで計算されており、ユーザー向けの出力は 1 つだけで、明確かつ適切です。 疲労を示唆する背景レベル あらゆる種類のアセットに調整されます。 ツールの最新情報を入手できる特別な電報チャットがあり、何か不足していると感じた場合はリクエストを送信することもできます! なぜURガンマ? 目標は、0 を中間点として、-1 と 1 の間で確率分布を振動させることです。 これを実現するために、アクティベーション関数と呼ばれる機械学習の手法を使用してデータを変換します。 そのような関数の 1 つ
UR Bands
Krzysztof Jan Debski
URバンド (機械学習システムで使用される式を使用) UR Bands は、機械学習システムで使用されるものと原理的に類似した、市場のボラティリティを組み込んだ数式によって導出される指標です。 この市場状況の数学的表現は、金融市場固有のボラティリティを考慮して、価格動向とダイナミクスの正確な分析を提供します。 ボラティリティを変数として組み込むことにより、インジケーターは市場の状況をより正確かつ信頼できる形で表現し、トレーダーや投資家が情報に基づいた意思決定を行い、リスクを効果的に管理できるようにします。 さらに、ボラティリティベースの式を使用することで、インジケーターは市場の変化に非常に反応しやすくなり、潜在的な取引や投資の早期シグナルを提供します。 UR バンドを使用する利点: 視覚的に楽しくわかりやすいオンチャートバンド あらゆる種類のアセットと時間枠に適応 常にトレンドの上下を示すバンド トレンドまたは反転取引システムのための優れた追加およびスタンドアロンのインジケーター ツールの最新情報を入手できる特別な電報チャットがあり、何か不足していると感じた場合はリクエス
UR Vortex
Krzysztof Jan Debski
UR Vortex The Probabilistic UR Vortex Formula: An Accurate System for Predictive Market Analysis using Volatility and Standard Deviation Calculations. The   UR Vortex   indicator is a technical analysis tool that uses volatility and standard deviation calculations to predict potential tops and bottoms in a market. It measures the strength of a trend by calculating the distance between the current price and a moving average, and then standardizing this distance by dividing it by the average true
UR パルススカルプ  ペースの速い市場で究極の優位性を求めるスキャルパー向けの調整済み取引指標 UR PulseScalp は、ペースの速い市場で究極の優位性を求めるスキャルパー向けの最先端の取引ソリューションです。 この革新的なインジケーターは、ボラティリティ、マネーフロー、相対強度の力を組み合わせて、非常に正確で信頼性の高いシグナルを作成する、科学的に調整された式に基づいて構築されています。 UR PulseScalp を使用する利点: 快適なインタラクティブパネル M5 と H1 で高精度 初心者におすすめの EURUSD ペア 設定なし あらゆる種類のアセットに調整 すべての波をキャッチするわけではありません - それがその美しさです。 それを待たなければならない場合でも、最良のエントリを分析します。 ツールの最新情報を入手できる特別な電報チャットがあり、何か不足していると感じた場合はリクエストを送信することもできます! UR PulseScalp を選ぶ理由 あなたがベテランのスキャルパーであろうと初心者であろうと、「UR PulseScalp」は
MetaTrader 4用 UR_TradeManager MetaTrader 4プラットフォーム専用に設計された究極のトレーディング強化ツールであるUR_TradeManagerを使用して、トレーディングポテンシャルを最大限に発揮しましょう。精密さと機能性を念頭に置いて作られたこの包括的なツールは、市場分析、実行、管理スキルを向上させたいトレーダーにとって不可欠です。 主な特徴: ビジュアルトレーディングダッシュボード : MetaTrader 4のワークスペースに統合された洗練されたダッシュボードから直接トレードを管理します。前例のない容易さと正確さで取引を実行、修正、終了させることができます。 リアルタイムニュース統合 : リアルタイムの更新情報で常に先を行きます。当ツールは、最新の市場データに基づいた情報に基づいて意思決定を行うことができるよう、重要な財務ニュースを直接トレーディング環境に引き込みます。 高度なアラートシステム : 価格レベル、市場イベント、またはインジケーターの結果に対するカスタムアラートを設定し、取引の機会や潜在的なリスクを決して見逃さないようにし、24時
UR ダイバージェンススポッター   UR DivergenceSpotter は、長年の経験の結果であり、時には最も簡単な方法が最善です。 いくつかの指標の間には良好な相関関係がありますが、それらが一致しない場合 (価格は「再調整」しようとします)、UR DivergenceSpotter でシグナルを受け取るのはその瞬間です。 UR Divergence Spotter を使用する利点: パラメータなし ろうそくの作成後に再描画しません シグナルが有効でなくなった場合のシグナル (つまり、トレードをより長く保持し、ストップ ロスを BE に設定して乗り、部分的な利益を得るか、完全に閉じることができます!)。 この指標は、長年の経験と観察の結果です。 それはしっかりしていて、テスト済みです。 より良い結果とより安全な信号を得るには、より高い時間枠 (h1/h4) で使用するのが最適です。 加えて、UR TrendExhaustion や UR VolumeTrend などの私の他のインジケーターと一緒に使用して、シグナルの精度を高めることもできます。 ツールの最新情
UR ボリュームトレンド   UR VolumeTrend は、出来高の継続的な傾向を示す最も明確な出来高インジケーターです。 UR TrendExhaustion などの他のインジケーターと完全に連携して、ローカルのトップとボトムを示します。 パラメータは 2 つだけに制限されています。値が高いほど、トレンドが長く表示されます。 極端な勾配は、潜在的な反転を捉えるためにボリュームが枯渇する可能性を示しています。 2 本の線 - 出来高の傾向と平均です。 最大の利点: 簡単で、すべてのアセットに合わせて調整できます。 ツールの最新情報を入手できる特別な電報チャットがあり、何か不足していると感じた場合はリクエストを送信することもできます! UR VolumeTrend を選ぶ理由 トレンドを捉えるには出来高が鍵となることは誰もが認めるところです。 このオシレーターは、1 つの使いやすいインジケーターに圧縮されたすべてのボリューム ツールの合計です。 見やすい方法で正/負のボリュームを示します。 背後にあるインターフェイスは、ボリュームが過去に比べて使い果たされている
URトレンド枯渇   UR TrendExhaustion は、パラメータ値やその他の設定を扱いたくないトレーダーにとって最適なソリューションです。誰にとっても簡単で視覚的に理解できるものです。 UR TrendExhaustion を使用する利点: パラメータなし チャートで何が起こっているかを最もよく表す 3 つの線があります: トレンド枯渇線、クジラ マネー ライン、リテール マネー ラインです。 インターフェイスは、両極端 (赤い領域) のいずれかのラインの枯渇を示しています。 最大の利点: 簡単で、すべてのアセットに合わせて調整できます。 ツールの最新情報を入手できる特別な電報チャットがあり、何か不足していると感じた場合はリクエストを送信することもできます! なぜ UR TrendExhaustion なのか? 私はキャリアを通じて多くの種類のインジケーターをコーディングしてきましたが、チャート上の他のツールを必要とせずに取引するためのこのシンプルでありながら最高の (imo) ツールをコーディングするためにすべての知識を集めました。 分かりやすく、
URの高値と安値   UR Highs&Lows は、価格の動きとそのボラティリティを詳細に分析し、価格が変動するチャネルを作成します。 そのチャネルは現在、オシレーターとして動き、価格の偏差と重ね合わされて、潜在的な枯渇と反転の可能性を示しています。 UR Highs&Lows を使用する利点: パラメータなし 価格の動きを表す 3 本の線があります - 価格の平均である白線と、その極値である青線です。 ヒストグラムは、価格のコンテキストにおける最大偏差の視覚化です インターフェースは、両極端 (上部の赤と下部の青の領域) のいずれかの線の枯渇を示しています。 最大の利点: 簡単で、すべてのアセットに合わせて調整できます。 ツールの最新情報を入手できる特別な電報チャットがあり、何か不足していると感じた場合はリクエストを送信することもできます! なぜ UR の高値と安値なのか? このインジケーターは、スタンドアロンのエントリーまたはエグジット インジケーターとして使用できます。 価格に依存しているため、すべてのチャートに適用でき、偏差計算アルゴリズムは数年の経
UR モメンター   UR Moenter は、オシレータとして表される価格変動の枯渇に相関する価格のモメンタムを完全に計算します。 したがって、これは潜在的な反転またはリトレースメントの本当に初期のシグナルを提供します. この公式は、2018 年に市場バブルが崩壊した後に発見されました。 UR Moenter を使用する利点: パラメータなし 価格の動きを表す 2 本の線があります。白線は、オシレーター (青い線) として表される価格の移動平均偏差と相関する価格のモメンタムです。 ヒストグラムは、価格の勢いに応じた最大偏差を視覚化したものです インターフェースは、両極端 (上部の赤と下部の緑の領域) のいずれかの線の枯渇を示しています。 最大の利点: 簡単で、すべてのアセットに合わせて調整できます。 ツールの最新情報を入手できる特別な電報チャットがあり、何か不足していると感じた場合はリクエストを送信することもできます! UR モメンターを選ぶ理由 このインジケーターは、スタンドアロンのエントリーまたはエグジット インジケーターとして使用できます。 価格に依存
UR フロントエンドバックエンド   UR FrontEndBackEnd は、サポートとレジスタンスの最も正確なレベルを見つけるための私のお気に入りの公式です。 また、それらをさまざまなカテゴリ (破線、実線、および領域) に分割して、その強度を示しています。 すべてがバッファに格納されるため、簡単にアクセスして他のツール内で実装できます。 追加: ツールは、適用される資産に合わせて調整する必要がある場合があります。資産は、ツールに影響する価格の桁数に関して異なります。 そのために必要なパラメーターは、設定で提供されます。 UR FrontEndBackEnd を使用する利点: 計算の密度と距離を設定するための 2 つのパラメーターのみ サポートとレジスタンスはバッファ内に保存され、指定された資産の価格から上昇/下降します サポート/レジスタンスラインの強さをすばやく視覚的にフィードバックするための 3 種類のライン -> DASHED、SOLID、AREA ツールの最新情報を入手できる特別な電報チャットがあり、何か不足していると感じた場合はリクエストを送信
URガンマ (機械学習システムで見られる同様の計算を利用) UR Gamma は、従来の WaveTrend インジケーターを新しく改善したものを提供する最先端の財務分析ツールです。 高度なデジタル信号処理技術を組み込むことにより、UR Gamma は、従来の WaveTrend アルゴリズムの制限の一部に対処し、価格行動の傾向を特定および測定するためのより正確で堅牢で動的なアプローチを提供します。 UR ガンマを使用する利点: ミニマルなセットアップ すべてのデータはバックグラウンドで計算されており、ユーザー向けの出力は 1 つだけで、明確かつ適切です。 疲労を示唆する背景レベル あらゆる種類のアセットに調整されます。 ツールの最新情報を入手できる特別な電報チャットがあり、何か不足していると感じた場合はリクエストを送信することもできます! なぜURガンマ? 目標は、0 を中間点として、-1 と 1 の間で確率分布を振動させることです。 これを実現するために、アクティベーション関数と呼ばれる機械学習の手法を使用してデータを変換します。 そのような関数の 1 つ
URバンド (機械学習システムで使用される式を使用) UR Bands は、機械学習システムで使用されるものと原理的に類似した、市場のボラティリティを組み込んだ数式によって導出される指標です。 この市場状況の数学的表現は、金融市場固有のボラティリティを考慮して、価格動向とダイナミクスの正確な分析を提供します。 ボラティリティを変数として組み込むことにより、インジケーターは市場の状況をより正確かつ信頼できる形で表現し、トレーダーや投資家が情報に基づいた意思決定を行い、リスクを効果的に管理できるようにします。 さらに、ボラティリティベースの式を使用することで、インジケーターは市場の変化に非常に反応しやすくなり、潜在的な取引や投資の早期シグナルを提供します。 UR バンドを使用する利点: 視覚的に楽しくわかりやすいオンチャートバンド あらゆる種類のアセットと時間枠に適応 常にトレンドの上下を示すバンド トレンドまたは反転取引システムのための優れた追加およびスタンドアロンのインジケーター ツールの最新情報を入手できる特別な電報チャットがあり、何か不足していると感じた場合はリクエス
UR Vortex MT5 The Probabilistic UR Vortex Formula: An Accurate System for Predictive Market Analysis using Volatility and Standard Deviation Calculations. The UR Vortex MT5 indicator is a technical analysis tool that uses volatility and standard deviation calculations to predict potential tops and bottoms in a market. It measures the strength of a trend by calculating the distance between the current price and a moving average, and then standardizing this distance by dividing it by the average
フィルタ:
レビューなし
レビューに返信
バージョン 1.10 2024.05.21
Boosted performance. Added identification.