Trend Range Indicator
- インディケータ
- Claudius Marius Walter
- バージョン: 1.0
Introduction
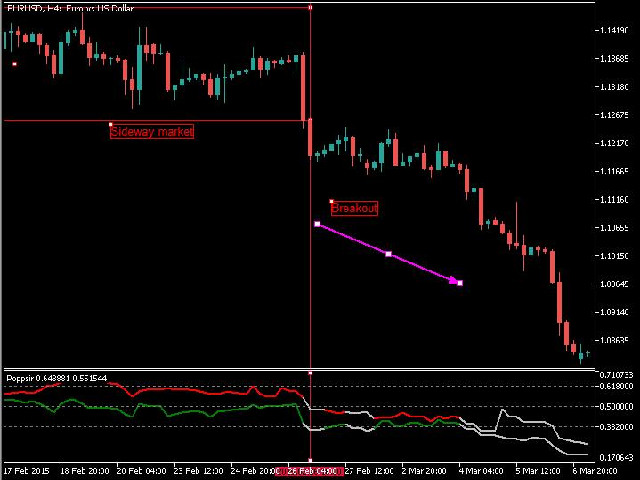
Poppsir is a trend-range indicator for metatrader 5 (for now), which distinguishes sideways phases from trend phases.
With this tool it is possible to design a trend following-, meanreversion-, as well as a breakout strategy.
This indicator does not repaint!
The signal of the Poppsir indicator is quite easy to determine. As soon as the RSI and Popsir change their respective color to gray, a breakout takes place or in other words, the sideways phase has ended.
Interpretation
RSI:
The formula for calculating the RSI is RSI = 100– (100/1 + RS), whereby RS is the quotient from the average of the closing course movements of
x bars with rising courses and the average of the closing course movements of x bars with falling courses. The default setting for x is 14 bars.
The RSI is therefore an extended momentum indicator. With increasing RSI value (RSI against 1), the average increasing closing course
movement of the last x bars predominates the falling courses within the last 14 bars. Values below 0.382 indicate a falling course.
Values above 0.681 indicate an increasing course. Values in between indicate a range.
Popp:
The formula for the Popp indicator remains my business secret.
The indicator supports the identification of sideways phases. Values above 0.382 indicate a pronounced range. Values below 0.382 indicate a breakout. The trend/breakout direction is determined by the RSI.
Important parameters
RSI parameter (green line)
Popp parameter (red line): Better to be the same length as RSI, but you are free to try other parameter settings
Lookback: How many bars should be calculated from the indicator (for faster calculation)
Final word
This indicator is updated annually
For any questions related to the purchase, installation, backtesting and use of the indicator, you can send me a private message on my profile here nn MQL5: https://www.mql5.com/de/users/steyr6155
Happy Trading!


Good, so promising