Engulfing Candle Pattern Alert MT5
Identify Engulfing candle pattern with Arrows & Alert (built-in RSI filter).
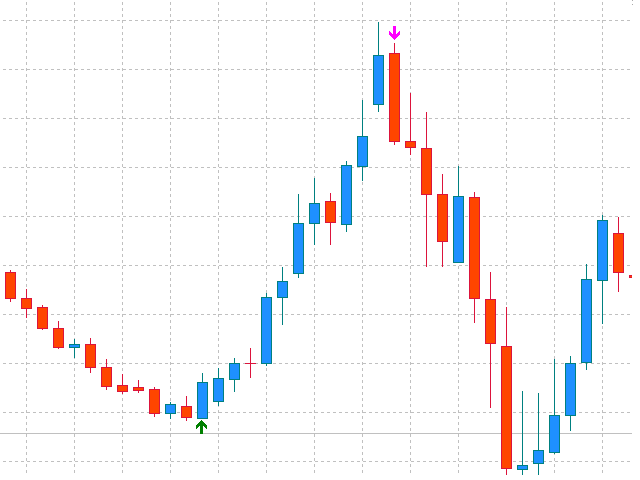
This indicator helps you to identify Engulfing candle pattern or Outside bar (OB) on the chart with arrows, along with an alert when a new Engulfing candle appears. Engulfing candle pattern is one of the most important reversal Price Action signals.
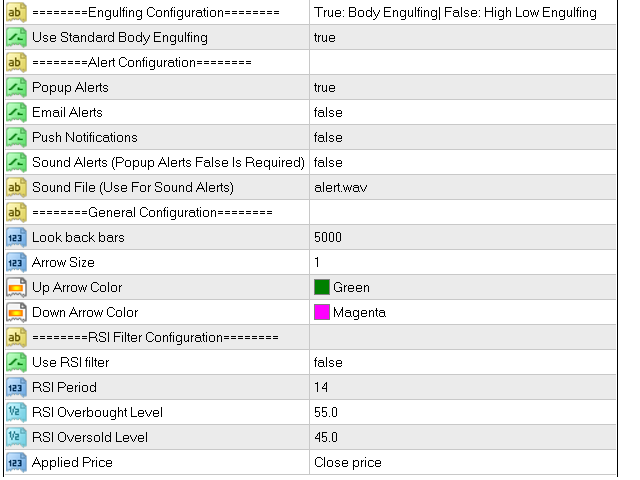
You can choose between standard Engulfing (Engulfing based on candle body) or non standard Engulfing (Engulfing based on candle high - low )
Alerts can be turned on and off:
Popup
Email
Push Notification
Sound (Note that popup alert must be turned off when using sound alert)
You can change arrow size and color.
The indicator has a built-in RSI filter, You can turn the RSI filter on and off, as well as change the parameter settings for the RSI.
You can filter by direction: Bullish And Bearish, Bullish Only, or Bearish Only.
To configure push Notification: Tools/Options/Notifications Tab
To configure Email: Tools/Options/Email Tab
Location of sound files: metatrader installation folder/Sounds folder
You can try in strategy tester before purchase (note the alert function does not work with strategy tester).
MT4 version: https://www.mql5.com/en/market/product/92278