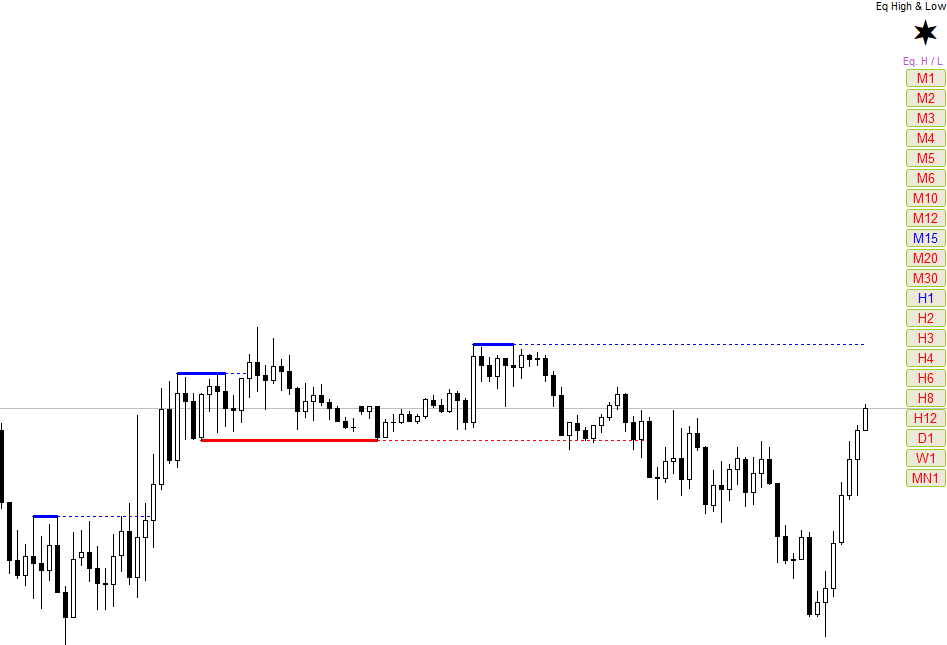
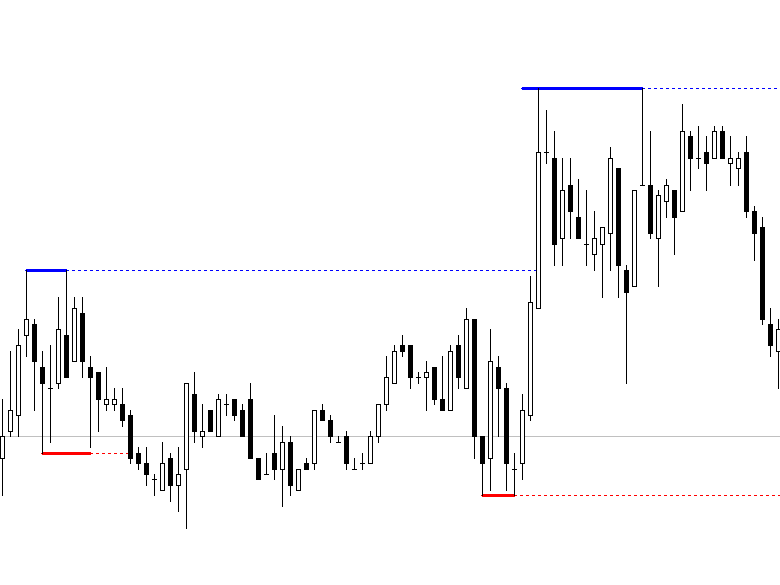
Equal Highs and Lows
- インディケータ
- Barend Paul Stander
- バージョン: 1.2
- アップデート済み: 5 6月 2024
- アクティベーション: 10
Equal Highs and Lows Indicator
Find and Mark Equal Highs and Lows on chart of Selected Multi Time frames.
Options:
- set min and max bars between Equal High's / Low's bars
- set max points difference between High's / Low's ( Sensitivity )
- Select time frames by buttons on chart
- Select / Filter only High's or Low's by a button
- Extend Equal High's / Low's line forward for chart reference